
The most dangerous way to pick dividend stocks is also the most common way: sort by yield, buy the biggest number, and hope. That approach confuses a price tag with a promise. A dividend is not interest. It is not guaranteed by a bank, by the exchange, or by the company that paid it last quarter. It is a decision a board of directors makes, again and again, out of cash the business actually has — and that decision can change.
That is why this guide to the best dividend stocks 2026 starts with a blueprint, not a list. First you will learn how to judge a dividend properly: how yield, payout ratio, cash flow, and dividend growth streaks fit together, and why one number on its own tells you almost nothing. Then you will get a clear, unmissable warning section on yield traps — the stocks whose eye-catching payouts are often a sign of trouble, not generosity. Only after that do the picks arrive, organised by the role they play in a portfolio rather than by who shouts the highest yield. Finally, there is a practical section on DRIP reinvestment and tax placement, because where you hold a dividend stock, and what you do with each payment, can matter almost as much as which stock you bought.
Every yield in this article is date-stamped and sourced. Unless a different date is stated next to it, yields and annual dividend amounts come from The Motley Fool’s dividend stock tables, data as of October 19, 2026, retrieved in October 2026. Yields move every trading day because yield is a dividend divided by a price, and prices move. Treat every figure here as a snapshot for research, not a live quote, and check the current yield, the most recent dividend announcement, and the company’s latest filing before you invest any money.
Related guides
- Best Online Broker 2026 — compare account costs and features before you buy your first dividend stock.
- Best Robo-Advisors 2026 — a hands-off route if you would rather have dividends managed inside a diversified portfolio.
- Best Roth IRA Accounts 2026 — why tax placement matters for dividend income, explained in account terms.
- How to Invest in Real Estate Without Buying Property — useful background before you treat REIT dividends like rent.
Helpful Official Resources
- Investor.gov — Dividend (glossary) — the U.S. Securities and Exchange Commission’s investor site defines a dividend as a portion of a company’s profit paid to shareholders, usually on a fixed schedule.
- IRS Topic No. 404 — Dividends and Other Corporate Distributions — the Internal Revenue Service explains ordinary versus qualified dividends and how they are reported on Form 1099-DIV.
- Check any company’s own dividend history and latest results on its investor relations page and in its SEC filings before relying on a roundup — including this one.
Risk disclaimer: This article is for education and general information only. It is not financial advice, not a recommendation to buy or sell any security, and not a promise of income or returns. Dividends can be reduced, suspended, or eliminated at any time. Stock prices fall as well as rise, and you can lose money, including principal. Past dividend payments and past growth streaks do not guarantee future payments. Talk to a qualified financial adviser and a tax professional about your own situation before investing.
The Income Blueprint: Judge the Dividend Before You Chase It
A good dividend has four tests to pass. A stock that fails one test is not automatically a bad investment, but it is automatically a stock you need to understand better before you own it. Think of these tests as a funnel. Yield tells you what is on offer. Payout ratio and cash flow tell you whether the offer is affordable for the company. The growth record tells you whether management has protected that payment through hard years, not just good ones. Your own time horizon tells you which combination you actually need.
Test 1: Yield — What You Get for Each Dollar Today
Dividend yield is simple arithmetic: the annual dividend per share divided by the current share price, expressed as a percentage. If a company pays $4 a year and the share costs $100, the yield is 4%. Investor.gov’s plain definition is a useful anchor here: a dividend is a portion of a company’s profit paid to shareholders. Yield translates that portion into a rate you can compare across stocks.
Here is the catch most beginners miss. Yield rises in two completely different ways. It rises when the company raises its dividend, which is usually healthy. It also rises when the share price falls while the dividend stays the same — and a falling price is often the market warning you that earnings, cash flow, or the dividend itself may be at risk. Same number, opposite meanings. That is why a 6% yield deserves a question, not automatic excitement, and why a 1% yield is not automatically disappointing: a low yield can belong to a fast-growing company that raises its payment every year.
Use yield as a sorting tool, not a verdict. Group stocks into broad bands — lower-yield growers, mid-yield payers, and higher-yield income names — and then apply the other tests inside each band. Do not compare a REIT, a utility, a bank, and a software company on yield alone, because their normal payout levels, tax treatment, and business risks are built differently.
Test 2: Payout Ratio — Can the Company Afford This?
The payout ratio is the share of earnings paid out as dividends: dividends per share divided by earnings per share. If a company earns $5 per share and pays $2, its earnings payout ratio is 40%, and it keeps 60% to reinvest, pay down debt, or build a cushion. As a rough, general guide used by many educators — not a rule — a moderate ratio for a typical mature company leaves visible headroom, a very high ratio leaves little room for a bad year, and a ratio sustained above 100% means the company is paying out more than it earns, which cannot continue indefinitely without reserves, asset sales, or borrowing.
Sector context changes everything. Real estate investment trusts, or REITs, are required to distribute most of their taxable income, so their earnings payout ratios routinely look extreme by ordinary standards; analysts usually judge REITs on funds from operations and adjusted funds from operations instead of simple earnings. Utilities and other regulated or capital-heavy businesses also tend to run higher payout levels than a software company would. Energy partnerships have their own distribution and cash-flow measures. In other words, compare a payout ratio with the company’s own sector and its own history, never with a single universal line.
This article deliberately does not print a payout ratio next to each pick. That is an editorial choice, and you should know why. Payout ratios change with every earnings report, different data providers calculate them on different earnings bases, and a single unsourced ratio pasted into a list would look precise while being easy to get wrong. Before you buy any name below, look up its payout ratio — and, for REITs and partnerships, its cash-flow coverage — in the company’s latest quarterly or annual filing. If you cannot find a coverage measure you understand, that is information too: slow down.
Test 3: Free Cash Flow — Earnings Are an Opinion, Cash Pays the Cheque
Accounting earnings can be shaped by depreciation, one-off charges, and other non-cash items. Dividends are paid in cash. So the most practical sustainability question is blunt: after the company pays its bills and invests what it must to keep the business running, is there cash left over for the dividend, with room to spare?
You do not need to build a financial model to ask this well. In the company’s cash flow statement, look at cash from operations, subtract capital spending, and ask whether the remainder comfortably covers the total dividend cost over time — not in one unusually good quarter, but across several years, including a weak one. A company that covers its dividend in good years only has not really covered it. A company that covered it through a downturn has given you evidence, not just a story.
Debt belongs in this test as well. Heavy debt payments compete directly with dividends for the same cash. When cash gets tight, lenders get paid under legal contracts. Shareholders get paid at the board’s discretion. That order of priority is the whole reason dividend cuts happen, and it is why balance-sheet strength is an income investor’s concern, not just a growth investor’s concern.
Test 4: The Growth Streak — Dividend Aristocrats and What a Streak Really Proves
A long record of raising the dividend is the closest thing dividend investing has to a character reference. The best-known version is the Dividend Aristocrats: as S&P Dow Jones Indices defines the S&P 500 Dividend Aristocrats Index, members are S&P 500 companies that have increased their dividend every year for at least 25 consecutive years, and meet size and liquidity requirements. SoFi’s October 2026 overview repeats the same core point in plain language: the Aristocrats list is made up of companies that have increased their dividend payout consecutively for 25 or more years. Fidelity, in its dividend education material, uses the same 25-year description and sensibly adds the warning that past performance is no guarantee of future results.
A 25-year streak is hard to fake. To keep one, a company has to raise its payment through recessions, rate shocks, and industry downturns, which means the business generated cash in bad conditions and management chose to protect the dividend when cutting it would have been easier. That is real evidence of durability. It is not, however, a guarantee, a valuation check, or a reason to overpay. A streak says nothing about whether today’s price is sensible, how fast the dividend is growing — a company can keep a streak alive with tiny increases — or whether the industry itself is shrinking slowly enough to threaten the next 25 years. Use Aristocrat status as a starting filter for research quality, not as a buy button.
Dividend Kings, companies with 50 or more consecutive years of increases, sit a tier above Aristocrats in streak length, but the same logic applies: admire the record, then still check yield, coverage, debt, and price.
The Yield Trap: Read This Section Twice
A yield trap is a stock whose high yield exists mainly because its price has collapsed, while the business problems that caused the collapse are still there. The dividend has not been cut yet, so the trailing yield looks generous. New buyers step in for the income. Then the board does what the cash flow was already signalling, cuts or suspends the payment, and the buyer is left holding a falling stock and a much smaller dividend than the one they thought they bought. They did not buy income. They bought someone else’s warning sign, at full price.
Learn the pattern, because it repeats in every market cycle:
- The yield is far above the company’s own sector. If similar, healthy companies yield 3% to 4% and one name yields 9%, the market is not offering you a gift. It is pricing in risk you need to identify.
- The price chart explains the yield. Check whether the yield is high because the dividend grew, or because the share price halved. Only one of those reasons is good news.
- Payout or cash-flow coverage is thin or negative. A dividend paid out of borrowing or shrinking reserves is a countdown, not an income stream.
- Debt is rising while revenue or earnings are falling. That combination squeezes the dividend from both sides, and interest must be paid before dividends can be.
- The dividend has been flat, then suddenly promoted on yield alone. Marketing that leads with yield and says nothing about coverage, debt, or cash flow is telling you which questions not to ask.
- One product, one customer, or one commodity drives everything. Concentration means one bad event can take the cash flow — and the dividend — with it.
None of this means every high yield is a trap. Some higher yields in the picks below belong to sectors built to pay out most of their cash — REITs and energy infrastructure, for example — and some belong to out-of-favour but cash-generative companies. Zacks made a version of this point in its October 2026 dividend coverage, warning that a high yield alone can be a warning sign and that dividend traps often pair eye-catching payouts with weak balance sheets or eroding cash flows, so the better focus is durability: payout discipline, consistent free cash generation, prudent leverage, and a record of maintaining or raising dividends. That is exactly the standard applied in this guide. The difference between a high yield and a yield trap is never the number. It is the evidence underneath the number.
A practical rule helps: for any stock yielding much more than the broad market, write down, in one sentence, why the market is offering that yield — and what would have to go wrong for the dividend to be cut. If you cannot write that sentence from the company’s filings, you do not understand the income yet, however attractive the percentage looks.
The Picks, Organised by Role — Not by Who Yields Most
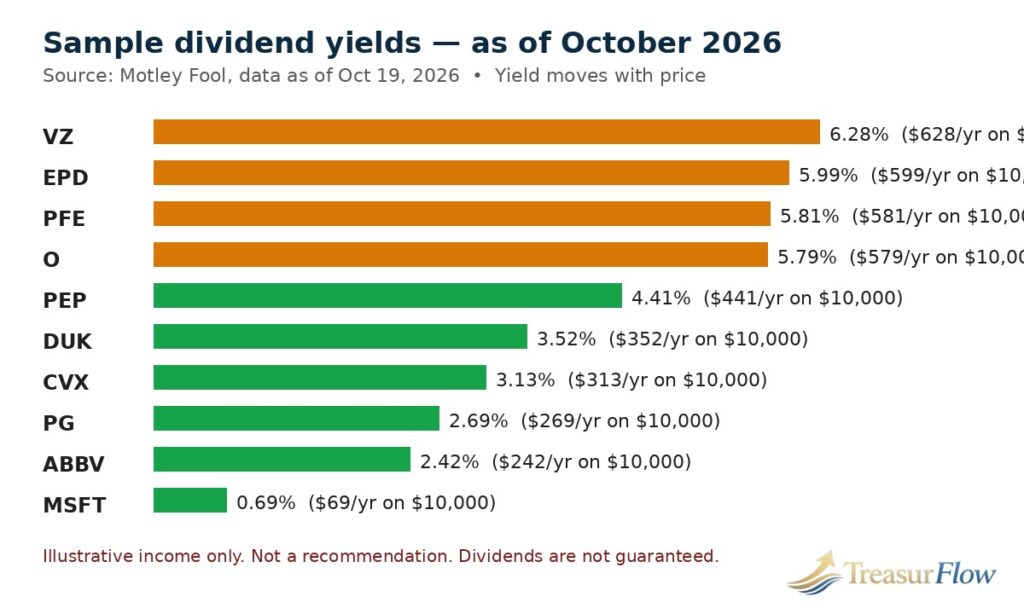
The list below is a research shortlist, not a model portfolio and not a recommendation. Names are grouped by the job they typically do, because a balanced dividend portfolio usually blends roles: some lower-yield growers whose income rises over time, some steady mid-yield payers, and a smaller, carefully checked set of higher-yield names for current income. All yields and annual dividend amounts are from The Motley Fool, data as of October 19, 2026, unless another date is stated. Prices, and therefore yields, will have moved since then.
| Role | Company (ticker) | Sector | Annual dividend | Yield, as of October 2026 |
|---|---|---|---|---|
| Dividend growth | Microsoft (MSFT) | Software | Not stated in source table | 0.69% |
| Core staples | Procter & Gamble (PG) | Household products | $4.29 | 2.69% |
| Healthcare growth | AbbVie (ABBV) | Biotechnology | $6.92 | 2.42% |
| Healthcare income | Pfizer (PFE) | Pharmaceuticals | $1.72 | 5.81% |
| Staples income | PepsiCo (PEP) | Beverages | $5.81 | 4.41% |
| Energy income | Chevron (CVX) | Oil and gas | $7.05 | 3.13% |
| Energy infrastructure | Enterprise Products Partners (EPD) | Oil and gas infrastructure | $2.21 | 5.99% |
| Utility income | Duke Energy (DUK) | Electric utilities | $4.28 | 3.52% |
| Monthly REIT income | Realty Income (O) | Retail REIT | $3.25 | 5.79% |
| Telecom income | Verizon (VZ) | Telecom services | $2.81 | 6.28% |
Role 1: Dividend Growth — Small Yield Now, Bigger Cheque Later
Microsoft (MSFT) — the reminder that yield is not the whole return
Microsoft yielded just 0.69% in the Motley Fool table, data as of October 19, 2026 — the lowest figure in this guide by a wide margin. On the worked maths below, $10,000 at 0.69% produces only $69 a year before tax. If your goal is income this year, that is not your stock, and no honest guide should pretend otherwise. Microsoft belongs in this section for the opposite reason: as the clearest example that dividend investing is not only about today’s rate. A company with a low starting yield can still be a dividend holding if its payment grows over time and its cash generation is strong, but the buyer is being paid mainly in future growth and price potential, not current cash. Judge names like this on total return and dividend growth, and do not force them into an income role they do not fit.
Procter & Gamble (PG) — the core staples template
Procter & Gamble paid an annual dividend of $4.29 and yielded 2.69%, data as of October 19, 2026, in the Motley Fool table. Household-products companies like this are the classic core template for dividend portfolios: everyday products, repeat purchases, and a business that does not depend on one fashionable product cycle. The yield will rarely excite anyone, and that is the point of the role. Core names are there to keep paying and, ideally, keep raising, while the higher-yield corners of a portfolio do the heavier income lifting — and carry the heavier risk. Before buying, still run the blueprint: check the latest payout and cash-flow coverage, the debt picture, and whether recent dividend growth is keeping pace with your own income goal.
AbbVie (ABBV) — healthcare growth with a mid-range yield
AbbVie paid an annual dividend of $6.92 and yielded 2.42%, data as of October 19, 2026. It sits between the pure growers and the pure income names: a real cash yield today, in a healthcare business where product concentration and patent timelines always deserve attention. For any drug maker, the key dividend question is what replaces today’s best-selling products when exclusivity fades, and whether the pipeline and acquisitions behind that answer are funded without starving the dividend. Read the latest earnings materials for that story in the company’s own words, then decide whether a 2.42% starting yield compensates you for the sector’s specific risks.
Role 2: Mid-Yield Income — The Engine Room
PepsiCo (PEP) — staples income above the core rate
PepsiCo paid an annual dividend of $5.81 and yielded 4.41%, data as of October 19, 2026 — noticeably above Procter & Gamble’s yield in the same broad consumer-staples world, which is exactly the kind of gap the blueprint tells you to investigate rather than simply celebrate. Ask why. Is the market worried about volume, pricing, costs, or debt from past deals? Sometimes the answer is a temporary worry that a patient buyer gets paid to accept. Sometimes it is the start of a longer slide. The dividend itself is only sustainable if snack and drink volumes, pricing power, and cash flow hold up together, so check those three in the latest results before treating 4.41% as a bargain.
Duke Energy (DUK) — regulated utility income
Duke Energy paid an annual dividend of $4.28 and yielded 3.52%, data as of October 19, 2026. Regulated electric utilities are a staple of income portfolios because demand for electricity is steadier than demand for most products, and regulators set frameworks within which utilities earn and invest. The trade-offs are just as structural: utilities carry large debts to fund power plants and grids, they spend heavily on infrastructure, and their returns are shaped by regulatory decisions. Interest rates matter here too — when bond yields rise, utility stocks often face competition as income investments and pressure on their valuations. A utility dividend is therefore not a bond coupon in disguise. It is an equity payment from a leveraged, regulated business, and it should be sized and checked like one.
Chevron (CVX) — energy income, with commodity risk stated plainly
Chevron paid an annual dividend of $7.05 and yielded 3.13%, data as of October 19, 2026. Large integrated energy companies earn across production, refining, and related businesses, which softens — but does not remove — the effect of oil and gas prices. That last clause is the whole risk section for this role. When energy prices fall hard and stay down, earnings and cash flow fall with them, buybacks usually slow first, and dividend growth can pause. Investors who need identical income every year, in every commodity environment, should not build that plan on energy dividends alone. Investors who can accept variable growth in exchange for a mid-range yield from a large, diversified energy business will find Chevron the standard name to research first in this sector — starting with how its dividend held up in the last energy downturn, in its own reported history.
Role 3: Higher Yield — More Income Today, More Homework First
Realty Income (O) — monthly REIT income, judged the REIT way
Realty Income paid an annual dividend of $3.25 and yielded 5.79%, data as of October 19, 2026, and it is widely known for paying monthly rather than quarterly. Monthly payment is a cash-flow convenience, not a safety feature, so judge this name the REIT way: on adjusted funds from operations coverage, occupancy, tenant quality, lease length, and debt — not on a simple earnings payout ratio, which is distorted for property companies by depreciation. Realty Income is a real estate investment trust, so its distributions also have different tax character from qualified corporate dividends in many cases; the IRS notes that REITs pay dividends to shareholders, and your Form 1099-DIV reporting will show how each year’s distributions are classified. Holders who want property-linked income without buying a building should also read the Treasurflow guide linked in the Related guides box, because a REIT is a company that owns property, not a slice of a house.
Enterprise Products Partners (EPD) — infrastructure distributions, different structure
Enterprise Products Partners paid an annual distribution of $2.21 and yielded 5.99%, data as of October 19, 2026, in the Motley Fool high-yield table, where its industry is listed as oil, gas and consumable fuels. Enterprise is an energy infrastructure partnership, not an ordinary corporation, and that structure matters twice. First, its cash flows come largely from pipelines and related infrastructure, which tend to be more fee-based than directly commodity-priced — though volume and energy-market health still matter. Second, partnership units typically bring different tax paperwork and treatment from ordinary shares, including partnership tax reporting rather than a simple dividend form in many cases. Do not buy a partnership for a 5.99% headline figure until you understand the tax administration that comes with it, in your own tax situation. That is not a flaw in the investment. It is a cost of ownership you should price in advance.
Pfizer (PFE) — high healthcare yield that demands the trap checklist
Pfizer paid an annual dividend of $1.72 and yielded 5.81%, data as of October 19, 2026. This is the pick where you should re-read the yield-trap section with the company’s name in mind — not because this guide is calling Pfizer a trap, but because a near-6% yield from a large drug maker is precisely the situation the checklist was built for. In its October 2026 coverage of dividend stocks to buy that month, The Motley Fool described Pfizer’s yield as supported by strong free cash flow in its contributor’s view, while also noting market concerns about future growth, revenue guidance implying a slight decline, and key drugs facing loss of patent protection. Both halves of that sentence belong in your research. Check free-cash-flow coverage of the dividend, the patent-expiry timeline, and the pipeline meant to replace expiring revenue. If those answers satisfy you, the yield is a researched decision. If you skip them, it is a hope.
Verizon (VZ) — the highest yield in this guide, and the clearest warning label
Verizon paid an annual dividend of $2.81 and yielded 6.28%, data as of October 19, 2026 — the highest yield in the table above. Telecom is a mature, capital-hungry industry: networks require constant investment, competition is relentless, and large debt loads are common. A 6.28% yield can be legitimate income from a mature cash-generative business, or it can be the market discounting slow growth and heavy obligations — and, realistically, it is usually a mixture of both. That makes Verizon a position-sizing lesson. Higher-yield names like this generally belong as a controlled portion of a diversified income portfolio, researched on cash flow after capital spending and debt service, not as the single stock an entire income plan depends on. If a dividend cut in your largest holding would break your budget, the portfolio — not just the stock — is the problem.
What the Income Actually Looks Like: Worked Maths on $10,000
Percentages hide dollars. Dollars are what pay bills, so here is the same information translated. The following figures were computed in Python from the yields above and are illustrative only: they assume you invest exactly $10,000, the yield stays exactly as stated, the dividend is neither raised nor cut, and they ignore taxes, fees, price changes, and reinvestment.
- At Microsoft’s 0.69% yield, as of October 2026: $10,000 × 0.69% = $69.00 a year, about $5.75 a month.
- At Procter & Gamble’s 2.69% yield: $10,000 × 2.69% = $269.00 a year, about $22.42 a month, or $67.25 a quarter.
- At Chevron’s 3.13% yield: $10,000 × 3.13% = $313.00 a year, about $26.08 a month.
- At Duke Energy’s 3.52% yield: $10,000 × 3.52% = $352.00 a year, about $29.33 a month.
- At PepsiCo’s 4.41% yield: $10,000 × 4.41% = $441.00 a year, about $36.75 a month.
- At Realty Income’s 5.79% yield: $10,000 × 5.79% = $579.00 a year, about $48.25 a month.
- At Verizon’s 6.28% yield: $10,000 × 6.28% = $628.00 a year, about $52.33 a month.
Now reverse the question, because it corrects the most common dividend fantasy. How much capital does it take to generate $500 a month — $6,000 a year — from yield alone? Computed in Python: at a 3% average yield you would need $200,000 invested; at 4%, $150,000; at 5%, $120,000. Those are illustrations at fixed yields, not forecasts, and real portfolios also gain or lose value as prices move. But the direction of the lesson never changes: meaningful dividend income is built from meaningful capital, dividend growth, and time — or from taking yield risk that this guide has spent two sections warning you about. Anyone promising large monthly income from a small deposit, without naming that trade-off, is selling something.
DRIP and Tax Placement: Keep More of What the Dividend Pays
DRIP — Let Each Payment Buy More Payments
A dividend reinvestment plan, or DRIP, automatically uses your dividends to buy more shares — including fractional shares at many brokers — instead of paying cash out to you. The compounding logic is simple and powerful in structure: more shares produce more dividends, which buy still more shares. As a purely illustrative calculation, computed in Python, $10,000 growing only by a reinvested 4% yield — ignoring price changes, dividend growth, taxes, and fees entirely — would reach $14,802.44 after 10 years. Real results will differ, possibly by a lot, because prices move and dividends change. The illustration exists to show the shape of compounding, not to project your return.
DRIP has three practical caveats. First, reinvested dividends in a taxable account are still generally taxable in the year received, even though you never touched the cash — the IRS treats dividends as distributions reported to you, and your broker’s Form 1099-DIV is the record. Keep your reinvestment records, because each reinvestment adds to your cost basis. Second, automatic reinvestment buys at whatever price prevails on the payment date, with no valuation check; some investors prefer taking cash and redeploying it deliberately. Third, DRIP inside a single stock concentrates you further in that stock. Reinvesting dividends from a diversified fund is a very different risk from reinvesting for a decade into one company.
If you would rather not manage individual-stock reinvestment at all, compare the managed route in the Best Robo-Advisors 2026 guide, and make sure whichever platform you choose actually supports fractional-share dividend reinvestment — check that in the Best Online Broker 2026 comparison before you open the account.
Tax placement — The same dividend is taxed differently in different accounts
Start with the official split. Under IRS Topic No. 404, dividends are classified as ordinary or qualified: ordinary dividends are included in ordinary income, while qualified dividends are those ordinary dividends that qualify to be taxed at lower capital gain rates, with the payer identifying the qualified amount on your Form 1099-DIV. Fidelity’s tax education, summarising IRS rules, states the same structure in rate terms: qualified dividends are taxed at the long-term capital gains rates of 0%, 15%, or 20% depending on income and filing status, and a separate 3.8% net investment income tax can apply above certain income thresholds. To qualify, dividends generally must be paid by a U.S. or qualifying foreign corporation and you must meet a holding-period test — more than 60 days during the 121-day period that begins 60 days before the ex-dividend date, per IRS rules summarised in the sources above. REIT distributions and partnership distributions often do not get qualified treatment, which is one more reason their higher headline yields are not directly comparable with a qualified corporate dividend.
Placement follows from that split, in general educational terms:
- Tax-advantaged retirement accounts can shelter dividends from annual tax while the money stays inside the account, which is why many income investors research holding higher-yield, non-qualified payers — such as many REITs — inside an IRA rather than a taxable account. The Best Roth IRA Accounts 2026 guide covers account choice in detail; contribution limits, withdrawal rules, and your own tax picture decide whether this fits you.
- Taxable brokerage accounts suit qualified-dividend payers relatively better, because the preferential rate may apply — but “relatively better” is not “tax-free,” and reinvested dividends are still reported.
- Partnerships and other special structures need individual tax advice before placement, because their reporting can affect both accounts differently.
Tax law changes, thresholds are updated, and state taxes add another layer. Use the IRS pages linked in the Helpful Official Resources box as your primary source, and confirm your specific treatment with a tax professional. Do not build a placement strategy from a blog article — including this one.
How to Build a Shortlist You Can Actually Defend
If you finish this guide and simply buy the highest yield in the table, the guide has failed — and so will the portfolio, eventually. Instead, use this sequence. First, decide the role you are filling: growth, core, mid-yield income, or higher-yield income, and only compare stocks inside that role. Second, run the four blueprint tests in order — yield in context, payout or cash-flow coverage from the company’s own filing, free cash flow across several years, and the growth record. Third, write the yield-trap sentence: why the market offers this yield, and what would cause a cut. Fourth, decide placement and DRIP before you buy, not after the first payment surprises you at tax time. Fifth, size the position so that a cut in any single name is an disappointment, not a disaster.
Diversification deserves its last word. Ten dividend stocks in one sector are not diversified income; they are one bet paid ten times. The roles above exist precisely to spread your income across staples, healthcare, energy, utilities, property, telecom, and technology, so that one industry’s bad year does not become your bad year. Dividend income feels calm month to month, which makes it easy to forget it is still equity risk. Respect that, and it can be one of the most understandable ways to own businesses: real companies, paying real cash, that you re-check with real numbers every year.
Dividend Questions Investors Actually Ask Before They Buy
What makes a stock one of the best dividend stocks for 2026?
It is not the highest yield alone. Look for a dividend covered by earnings and free cash flow, a payout ratio that leaves room for a bad year, manageable debt, and a record of maintaining or raising the payment. Then check that the current price and yield still make sense for the role the stock plays in your portfolio.
Is a 6% dividend yield always a good deal?
No. A yield can reach 6% because the company raised its dividend, or because the share price fell on bad news. If payout coverage is thin, debt is rising, or cash flow is falling, a high yield can be a yield trap that ends in a dividend cut. Always check why the yield is high before you buy.
What is a Dividend Aristocrat?
A Dividend Aristocrat is an S&P 500 company that has increased its dividend every year for at least 25 consecutive years and meets the size and liquidity rules of the S&P 500 Dividend Aristocrats Index. The streak is evidence of durability, but it is not a guarantee that the dividend will keep rising or that the stock is cheap today.
How much income does a $10,000 dividend investment pay?
It depends on the yield. Illustratively, $10,000 at a 3.13% yield pays $313.00 a year before tax, and $10,000 at a 5.79% yield pays $579.00 a year before tax, assuming the yield and dividend stay unchanged. Real income changes when dividends are raised, cut, or reinvested, and when you pay tax on them.
Are dividends taxed if I reinvest them through a DRIP?
Generally, yes, in a taxable account. Reinvested dividends are still dividends for tax purposes and are reported on Form 1099-DIV, even though you received shares instead of cash. Dividends inside a retirement account follow that account’s tax rules instead. Check IRS Topic No. 404 and confirm your own situation with a tax professional.
Should I hold REITs in a Roth IRA or a taxable account?
Many investors research holding REITs in a tax-advantaged account because REIT distributions often do not qualify for the lower qualified dividend tax rates, so sheltering them from annual tax can help. Whether a Roth IRA is right for you depends on contribution limits, withdrawal rules, and your overall tax picture, so treat this as a research starting point, not personal tax advice.
Conclusion
The best dividend stocks 2026 are not the ones with the biggest percentages next to their names. They are the ones whose payments survive your questions: covered by cash flow, sized sensibly against earnings, supported by a balance sheet that does not need perfect years, and held in the right account with a clear plan for each payment. Start with the blueprint, respect the yield trap, blend growers with payers instead of chasing a single role, and re-check every holding against its own filings at least once a year. Dividend income rewards patience and evidence in roughly equal measure — bring both, and let the cash companies pay you while you wait.

Muhammad Zakir is the founder of Treasurflow and the author of its personal finance guides. He researches consumer banking, credit, and personal loans, and every guide cites primary sources such as the CFPB, FDIC, FTC, and IRS. His content is educational and is not personalized financial advice.