If you are shopping for the best dividend ETFs 2026 has to offer, the first question is not “which fund yields the most?” It is “what job do you need this money to do?” A retiree who needs cash in the account every month, a 35-year-old who will not spend a dividend for 25 years, and a worker building a taxable brokerage account alongside a Roth IRA are three different investors. The fund that is brilliant for one of them can be a mediocre — or even tax-inefficient — choice for another.
That is why this guide does not rank seven funds from first to worst on yield alone. Instead, it splits dividend investing into two honest camps, then groups every fund by the job it actually does.
Camp 1 — Income now. You need distributions you can spend soon: quarterly cheques that meaningfully supplement a pension, Social Security, or part-time work, or a monthly distribution that lines up with rent and bills. For you, the current distribution rate matters most, but so does whether that payout is built on durable company profits or on financial engineering.
Camp 2 — Growing income. You do not need to spend the money yet. You need an income stream that is bigger in ten years than it is today, because the companies inside the fund keep raising their dividends. Your starting yield will look unimpressive — sometimes barely above the broad market — and that is the point. You are buying tomorrow’s yield, not today’s.
Almost every mistake in dividend investing comes from mixing up these two camps: buying a high-yield fund for long-term growth and then wondering why the share price went nowhere, or buying a dividend-growth fund for rent money and then wondering why the payments feel so small. Read the camp descriptions again, decide which one sounds like you, and then read the fund cards in that group first.
Important disclaimer: This article is educational information only and is not financial advice, a recommendation, or a solicitation to buy any fund. Dividend yields, expense ratios, and holdings cited here are as reported in October 2026 and change over time. Dividends are never guaranteed — companies can cut them and funds can reduce distributions. Past performance does not guarantee or predict future results. Consider speaking with a qualified financial adviser and a tax professional about your own situation before investing.
Related Guides
- Best Roth IRA Accounts 2026 — where tax-free dividend growth compounds best
- Best Robo-Advisors 2026 — hands-off portfolios that can hold dividend ETFs for you
- Best Online Brokers 2026 — where to buy these ETFs commission-free with DRIP support
Helpful Official Resources
- Investor.gov — Beginners’ Guide to Investing — the SEC’s free investor education site
- FINRA — Understanding Mutual Funds and ETFs — regulator guidance on fund costs and risks
- IRS — Topic No. 404, Dividends — the official rules on qualified vs. ordinary dividends
How We Compared These Funds (and How to Read the Numbers)
Every yield and fee in this article is date-stamped as of October 2026, because a dividend yield is a moving target: it rises when prices fall and falls when prices rise, even if the underlying cash payout has not changed at all. We cross-checked figures against issuer materials from Vanguard, Schwab, iShares (BlackRock), JPMorgan, and State Street, and against independent data compilations from StockAnalysis.com, Morningstar-based reporting, and contemporaneous October 2026 fund coverage. Where sources report slightly different yields for the same fund — and they do, because a 30-day SEC yield, a distribution rate, and a trailing 12-month yield are three different calculations — we say which measure we are using and we do not blend them silently.
Here is the short version of those three measures. The trailing 12-month yield divides the last twelve months of actual distributions by the current price; it tells you what the fund did pay. The distribution rate annualises the most recent distribution; it is more current but noisier, especially for a monthly payer whose last payment was unusually large or small. The 30-day SEC yield is a standardised snapshot of recent income from the portfolio, required to be calculated the same way across funds, which makes it the fairest — if driest — comparison number. None of the three is a forecast, and none is a promise of what you will receive next quarter.
We also weighted four things that a simple yield ranking ignores. First, how the yield is produced: ordinary dividends from profitable companies behave very differently from option premium. Second, the screen behind the fund: a quality screen that excludes companies with stretched balance sheets is worth real money in a recession. Third, cost: six of our seven funds charge between 0.04% and 0.08% a year; the seventh charges 0.35%, and that gap needs to be justified, not ignored. Fourth, holdings breadth: a 75-stock fund and a 600-stock fund can both be called “diversified” while exposing you to very different single-company and single-sector risk.
The Full Comparison Table
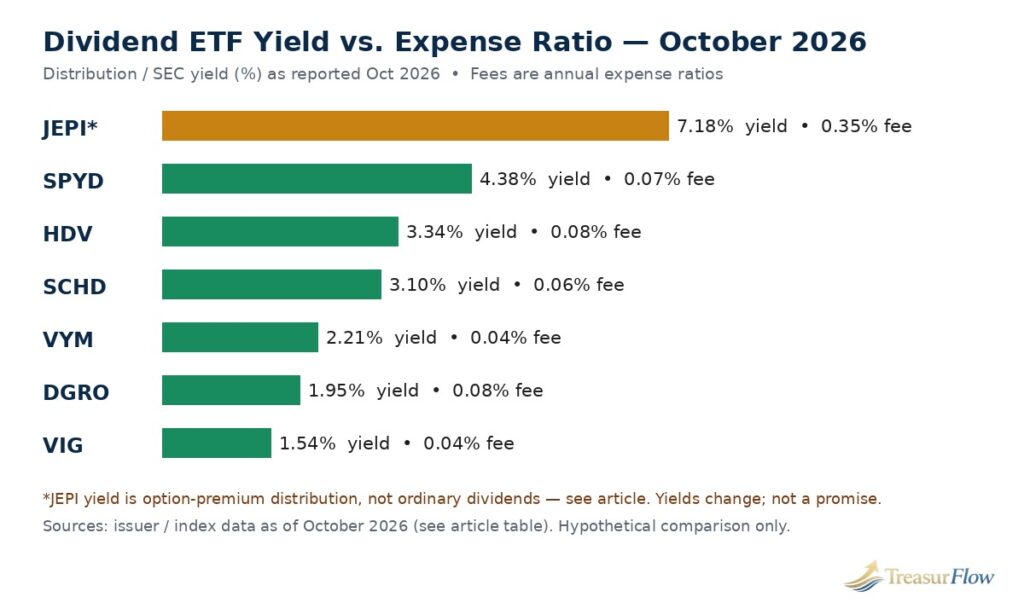
All figures below are as of October 2026. Yields are the distribution or SEC yield measure reported for each fund in October 2026 coverage and issuer data (see each fund card for the specific measure); holdings counts are the most recent counts reported in October 2026.
| Ticker | Fund | Yield (Oct 2026) | Expense ratio | Holdings | Pays |
|---|---|---|---|---|---|
| SCHD | Schwab U.S. Dividend Equity ETF | 3.10% | 0.06% | 102 | Quarterly |
| VYM | Vanguard High Dividend Yield ETF | 2.21% | 0.04% | ~605 | Quarterly |
| VIG | Vanguard Dividend Appreciation ETF | 1.54% | 0.04% | 335 | Quarterly |
| DGRO | iShares Core Dividend Growth ETF | 1.95% | 0.08% | ~392 | Quarterly |
| HDV | iShares Core High Dividend ETF | 3.34% | 0.08% | ~75 | Quarterly |
| SPYD | SPDR Portfolio S&P 500 High Dividend ETF | 4.38% | 0.07% | 78 | Quarterly |
| JEPI | JPMorgan Equity Premium Income ETF | 7.18% | 0.35% | 137 | Monthly |
Read that table the right way: it is a menu of trade-offs, not a leaderboard. SPYD’s 4.38% comes from holding only the 80 highest-yielding names in the S&P 500, equally weighted — concentration is the price of that yield. JEPI’s 7.18% is not a dividend yield at all in the ordinary sense, as its card below explains in full. VIG’s 1.54% is the lowest number in the table and, for a Camp 2 investor with decades to go, may still be the most valuable row here.
Group 1 — Highest Quality Yield: SCHD
SCHD — Schwab U.S. Dividend Equity ETF
If there is a default answer to “one dividend ETF, please,” it is SCHD — not because it yields the most, but because of how it earns its yield. SCHD tracks the Dow Jones U.S. Dividend 100 Index, which starts with companies that have paid dividends for at least ten consecutive years and then ranks them on financial quality measures including cash-flow-to-debt, return on equity, and dividend growth, alongside yield itself. In plain English: a company cannot buy its way into this fund with a huge, unsustainable payout. It has to be profitable, sensibly levered, and already committed to raising its dividend.
As of October 2026, SCHD yielded 3.10%, charged 0.06% a year, and held 102 stocks, paying quarterly. Its largest positions in October 2026 reporting included familiar blue chips such as Texas Instruments, Procter & Gamble, ConocoPhillips, Coca-Cola, and Chevron, with consumer defensive and healthcare the biggest sector weights. That sector mix explains both SCHD’s appeal and its limits: it tilts defensive and value-oriented, with very little of the high-flying technology exposure that drives the broad market in strong tech years. In a year when mega-cap tech leads, SCHD will usually lag a total-market fund. In a flat or falling market for growth stocks, its profitable, cash-returning holdings have historically been the steadier ride — though “steadier” is a description of the past, not a guarantee about the next downturn.
Best for: Camp 1 investors who want meaningful income without chasing the riskiest yields, and Camp 2 investors who want one fund that straddles both camps. Watch out for: concentration — 102 holdings with the top ten around two-fifths of the fund — and a March index reconstitution that can change the portfolio noticeably from one year to the next.
Group 2 — Dividend Growth: VIG and DGRO
VIG — Vanguard Dividend Appreciation ETF
VIG is the purest Camp 2 fund in this guide. It tracks the S&P U.S. Dividend Growers Index: U.S. companies that have raised their dividends for at least ten straight years, with the very highest-yielding names excluded — a deliberate design choice, because the highest yielders are statistically the companies most likely to cut. The result, as of October 2026, was a yield of just 1.54%, an expense ratio of 0.04% — tied for the cheapest in this guide — and 335 holdings, paid quarterly.
That 1.54% is the number sceptics quote, so let us put it in the frame it deserves. A dividend-growth fund’s return story has two engines: the starting yield, plus the growth rate of the payout itself. A fund yielding 1.54% whose underlying companies raise dividends steadily can, over a long holding period, deliver a rising income stream on your original cost — what investors call yield on cost — that eventually rivals a static high-yield fund, while also holding the kind of financially disciplined companies (VIG’s October 2026 leaders included large technology, financial, and healthcare names) that tend to keep compounding their share prices. None of that is guaranteed: a recession can freeze dividend growth across the market, and VIG fell hard in past bear markets along with everything else. But if your horizon is fifteen years or more and you will reinvest every payment, VIG’s low starting yield is a feature of its discipline, not a flaw in the fund.
Best for: younger and mid-career investors, Roth IRA holders (see the taxes section), and anyone who wants dividend exposure that behaves most like the broad quality end of the stock market. Watch out for: disappointment if you need spendable income soon — on $50,000, a 1.54% yield is roughly $770 a year before taxes, as the income maths section shows.
DGRO — iShares Core Dividend Growth ETF
DGRO takes the dividend-growth idea and broadens it. It tracks the Morningstar US Dividend Growth Index, which requires a five-year record of dividend increases — half of VIG’s ten-year bar — and adds sustainability screens based on earnings and payout ratios, excluding the highest payout ratios where a dividend is most likely to be living beyond the company’s means. As of October 2026, DGRO yielded 1.95%, charged 0.08%, and held roughly 392 stocks, paying quarterly.
The practical difference from VIG is breadth and balance. With a shorter required growth streak, DGRO admits younger dividend payers and ends up with a portfolio that sits between VIG’s quality-growth tilt and SCHD’s value tilt, with heavy weights in financials, healthcare, and technology. Its 0.08% fee is still very cheap in absolute terms — $40 a year on a $50,000 holding — but it is double VIG’s 0.04%, and over decades a Camp 2 investor should ask whether DGRO’s broader net is worth twice the (still tiny) fee. For many investors the honest answer is that the two funds overlap enough that owning both adds complexity more than diversification; pick the philosophy you prefer — VIG’s longer, stricter growth record, or DGRO’s wider, sustainability-screened one — and hold it properly.
Best for: Camp 2 investors who want dividend growth with a broader, more balanced sector mix than VIG. Watch out for: a yield (1.95%) that is still firmly in “reinvest it” territory, and meaningful overlap if you already own VIG or SCHD.
Group 3 — Broad High Yield: VYM, HDV, and SPYD
VYM — Vanguard High Dividend Yield ETF
VYM is the broad-net option: it tracks the FTSE High Dividend Yield Index, taking the higher-yielding half of U.S. dividend payers and weighting them by market size. As of October 2026, that meant roughly 605 holdings, a yield of 2.21%, an expense ratio of just 0.04%, and quarterly payments. With 605 stocks, VYM is by far the most diversified fund in this guide — no single company, and no single sector bet, dominates it the way SCHD’s top ten or HDV’s 75 names can dominate theirs.
The trade-off is dilution. Because VYM holds everything that yields above average — including plenty of slow-growth, mature businesses — its yield lands in the middle of the pack at 2.21%, and its dividend growth has historically been more modest than the dedicated growth funds. Think of VYM as the dividend-market equivalent of a broad index fund: you will never be able to say it was the best performer over any given stretch, but you are also unlikely to be hurt by one bad screen or one concentrated sector. For an investor who wants a single, cheap, set-and-forget dividend core and plans to top it up with a growth fund later, VYM is the natural starting point.
Best for: investors who prize breadth and the joint-lowest fee above maximum yield, and anyone building a simple two-fund core (for example, VYM plus VIG). Watch out for: a middling yield that will not satisfy a true Camp 1 investor, and slower dividend growth than the dedicated Camp 2 funds.
HDV — iShares Core High Dividend ETF
HDV goes the opposite direction from VYM: instead of breadth, it offers a focused portfolio of roughly 75 stocks, screened not just for high dividends but for quality — Morningstar’s moat and financial-health measures are built into its index. The result, as of October 2026, was a yield of 3.34% — the highest of any conventional dividend fund in this guide — at an expense ratio of 0.08%, paid quarterly, with heavy weights in healthcare, consumer staples, and energy.
That combination, high yield with a quality screen, is genuinely appealing, and HDV’s defensive sector mix has historically made it one of the calmer rides in equity drawdowns. The cost of the focus is concentration: with only about 75 names, a handful of large positions drive most of the return, and the fund’s fortunes are tied to a few sectors. If energy has a bad decade, HDV feels it in a way VYM’s 605 stocks never would. HDV also overlaps heavily with SCHD’s hunting ground — profitable, cash-generative large caps — so owning both is less diversification than it first appears; choose HDV if you specifically want the higher yield and the moat screen in one concentrated package.
Best for: Camp 1 investors who want the highest conventional yield available with a quality filter, and who are comfortable with concentration. Watch out for: sector concentration (healthcare, staples, energy) and overlap with SCHD.
SPYD — SPDR Portfolio S&P 500 High Dividend ETF
SPYD takes the 80 highest-yielding stocks in the S&P 500 and weights them equally. That is the whole strategy — no quality screen, no payout-ratio filter, no growth requirement. As of October 2026, it produced the highest conventional yield in this guide, 4.38%, from 78 holdings at a 0.07% expense ratio, paid quarterly, with real estate and utilities featuring heavily, as they always do in an unscreened high-yield portfolio.
Equal-weighting 80 high yielders cuts both ways. On the plus side, no single company can sink the fund, fees are low, and the yield is real cash from real S&P 500 companies. On the minus side, an index that selects purely on yield systematically loads up on companies whose prices have fallen — which is often the market’s early warning of a dividend cut — and SPYD’s history includes exactly that experience in the 2020 crash, when its payout fell sharply as holdings slashed dividends. SPYD belongs in this guide because some investors genuinely want maximum current yield from recognisable large caps at a tiny fee, and for a diversified, watchful investor it can play that role. It does not belong on any list of “safe” income, and it should never be the whole plan.
Best for: yield-focused investors who understand and accept cut risk, held as one sleeve of a broader portfolio rather than the whole core. Watch out for: dividend cuts in recessions — the fund’s yield is highest partly because its holdings are the market’s most stretched payers — and heavy real-estate/utilities exposure.
Group 4 — Monthly Income, a Different Animal: JEPI
JEPI — JPMorgan Equity Premium Income ETF
JEPI needs its own group because it is not really a dividend fund at all, and honest labelling matters more here than anywhere else in this guide. JEPI is an actively managed fund that holds a defensive portfolio of large U.S. stocks (137 holdings as of October 2026, per StockAnalysis.com) and, on top of that, sells call options on the S&P 500 through equity-linked notes. The option premiums — payments from investors buying those calls — are the main engine of its distributions. As of October 2026, JEPI’s distribution rate was reported at 7.18%, its expense ratio was 0.35%, and it pays monthly.
Every part of that paragraph carries a consequence. Monthly payment is genuinely useful for budgeting — it is the only fund here that matches a monthly bill cycle — but monthly amounts vary (recent 2026 monthly payments ranged roughly between $0.34 and $0.45 per share in contemporaneous reporting), so it is monthly income, not a monthly salary. The 7.18% is mostly option premium and partly dividends, not a portfolio of companies yielding 7%; that income does not grow the way company dividends can, and in a strong bull market the sold calls cap JEPI’s participation — by design, it trades away some upside for current cash flow and historically lower volatility than the S&P 500. The 0.35% fee is five times SCHD’s and nearly nine times VIG’s: $175 a year on $50,000, versus $20–$30 for the index funds. And the tax character of JEPI’s distributions is typically less favourable in a taxable account than the qualified dividends of the index funds, as the next sections explain.
Best for: retirees and other Camp 1 investors who specifically value monthly cash flow and smoother rides, understand the capped-upside trade, and ideally hold JEPI inside a tax-advantaged account. Watch out for: buying JEPI as a “high-dividend growth” fund — it is neither — and for comparing its distribution rate head-to-head with dividend yields as if they were the same thing.
What $50,000 Actually Pays: Hypothetical Income Maths
Yields become real when you attach a dollar amount to them. The table below is hypothetical and illustrative only: it simply multiplies a $50,000 investment by each fund’s October 2026 yield figure. It assumes the yield never changes — which it will — ignores taxes, fees drag on distributions, price moves, and reinvestment, and it is not a prediction or promise of income you will receive.
| Fund | Yield used (Oct 2026) | Illustrative annual income on $50,000 | Illustrative monthly average | Illustrative quarterly payment |
|---|---|---|---|---|
| VIG | 1.54% | $770.00 | $64.17 | $192.50 |
| DGRO | 1.95% | $975.00 | $81.25 | $243.75 |
| VYM | 2.21% | $1,105.00 | $92.08 | $276.25 |
| SCHD | 3.10% | $1,550.00 | $129.17 | $387.50 |
| HDV | 3.34% | $1,670.00 | $139.17 | $417.50 |
| SPYD | 4.38% | $2,190.00 | $182.50 | $547.50 |
| JEPI | 7.18% | $3,590.00 | $299.17 | $897.50 |
Three lessons hide in that arithmetic. First, the Camp 2 reality check: the difference between VIG and SCHD on $50,000 is about $780 a year today — real money, but not life-changing money, and the Camp 2 argument is that VIG’s payout grows while a static comparison freezes both funds in October 2026 forever. Second, the JEPI reality check: $3,590 looks like the obvious winner until you remember it is largely option premium with capped upside and a $175 annual fee on that $50,000 (versus $20 for VIG or VYM, $30 for SCHD, $35 for SPYD, and $40 for DGRO or HDV — fee figures computed from the expense ratios in our comparison table). Third, scale: at these yields, meaningful spendable income requires meaningful capital. A 3.10% yield turns $10,000 into roughly $310 a year, not a rent payment. Dividend investing rewards patience and contribution size far more than it rewards clever fund-picking between already-cheap, already-sensible funds.
Taxes on Dividends: The Section That Changes Where You Hold These Funds
For U.S. investors, where you hold a dividend ETF can matter as much as which one you hold, because dividends are taxed in the year they are paid in a taxable brokerage account — even if you reinvest every cent and never touch the cash. The IRS (see Topic No. 404 in our resources box) divides dividends into two kinds.
Qualified dividends meet IRS holding-period and source requirements — broadly, dividends paid by U.S. corporations (and certain qualified foreign ones) on stock held for more than 60 days in the 121-day window around the ex-dividend date. They are taxed at the long-term capital gains rates: 0%, 15%, or 20% depending on taxable income, plus a possible 3.8% net investment income tax at higher incomes. Most dividends paid by the U.S. equity index funds in this guide — SCHD, VYM, VIG, DGRO, HDV, SPYD — are largely qualified in a typical year, though each fund reports its exact qualified percentage annually and it is never something to assume is 100%.
Ordinary (non-qualified) dividends are taxed at your regular income tax rates, which for many investors are materially higher. This bucket catches, among other things, distributions sourced from option premium and certain other income — a key reason JEPI’s distributions are generally less tax-friendly in a taxable account — as well as REIT dividends (largely absent here, since VYM’s index excludes REITs, though SPYD’s high-yield universe includes real-estate names whose character flows through the fund’s annual tax reporting).
That distinction drives the classic placement rule of thumb. In a Roth IRA, qualified or not, dividends are not taxed as they arrive, and qualified withdrawals in retirement are tax-free — which makes a Roth a natural home both for high-distribution funds like JEPI and for dividend-growth funds like VIG and DGRO whose compounding you never want interrupted by an annual tax bill. In a traditional IRA or 401(k), dividends are sheltered year to year and taxed on withdrawal as ordinary income. In a taxable account, favour the funds whose distributions are mostly qualified and modest in size — the low-yield growers and broad index funds — and think twice before parking a high monthly distribution there, where it creates tax due every single year whether you spend it or not. Tax law changes and individual circumstances vary widely; the percentages and brackets above are general education, not tax advice, and a tax professional can map them to your return.
DRIP: Putting the Snowball on Autopilot
DRIP — a dividend reinvestment plan — is your broker’s setting that automatically uses each distribution to buy more shares, including fractional shares, instead of leaving cash in the account. Every fund in this guide can be held with DRIP switched on at any major U.S. brokerage, usually at no commission.
Why does an article about income devote a section to not taking the income? Because for Camp 2 investors, reinvestment is where the strategy lives. Each reinvested dividend buys shares that themselves pay dividends, so your income base compounds even if no company raises anything. To feel the scale: purely as arithmetic, reinvesting a steady 3.10% yield with a flat share price for ten years grows your share count by a factor of about 1.36 — more than a third more shares, and therefore more than a third more income at the same yield, before any dividend growth or price change at all. Real life will not be that tidy — prices move, yields drift, companies raise and occasionally cut — but the direction of the machine is real, and it is free.
Practical DRIP notes matter too. In a taxable account, reinvested dividends are still taxable in the year paid, and each reinvestment creates a new tax lot, which makes record-keeping (your broker tracks cost basis, but check) and tax-loss harvesting more fiddly. DRIP also buys on the fund’s schedule, not yours — you cannot time the reinvestment price. And when you cross from Camp 2 into Camp 1 — retirement, a career break, a sabbatical — turning DRIP off and letting the cash land is a perfectly good “pay rise” that requires selling nothing. Many investors run a hybrid: DRIP on inside retirement accounts for maximum compounding, distributions paid in cash in the taxable account for flexibility and simpler taxes.
Risks: What Dividend ETFs Will Not Do
A clear-eyed guide owes you the failure modes, in plain language.
They will not protect your capital. Every fund here is a stock fund. Dividend payers fell sharply in 2008–09 and in other bear markets, and SCHD, VYM, and their peers will fall in the next one too — perhaps less than the frothiest growth stocks, perhaps not. A dividend is not a coupon on a bond; there is no maturity date and no promised principal back.
They will not guarantee the dividend. Companies cut dividends precisely when times are worst, and funds pass those cuts straight through. Index screens based on ten-year payment records (SCHD, VIG) reduce this risk; they do not repeal recessions.
They will not keep up in every market. Dividend and value tilts can lag for years when growth and technology lead, as S&P Dow Jones Indices’ long-running SPIVA scorecards have repeatedly shown for active and style-tilted strategies versus broad benchmarks — underperformance stretches are a documented feature of style investing, not a sign your fund is broken. If watching a total-market fund beat your dividend fund for three straight years would make you sell at the bottom of the style cycle, a broad fund plus a smaller dividend position may suit your temperament better.
They carry concentration you cannot see from the yield. HDV holds about 75 stocks with heavy energy and staples weights; SPYD equal-weights the 80 highest yielders with roughly a quarter in real estate in recent reporting; SCHD’s top ten is around two-fifths of the fund. Diversified for a dividend fund is not the same as diversified, full stop.
Yield itself is a risk signal at the extremes. A yield that is high because the price collapsed is the market pricing in a cut — the classic yield trap. JEPI adds its own distinct risks on top: capped upside by design, active-management and options-overlay complexity, variable monthly amounts, and a 0.35% fee that compounds quietly against you. Fees, finally, are the one guaranteed number in this entire article: on $50,000, the difference between a 0.04% fund ($20 a year) and JEPI’s 0.35% ($175 a year) is $155 every year, in good markets and bad.
How to Choose: A Simple Decision Path
Work through these four questions in order. Do you need to spend the income within the next few years? If not, start in Group 2 (VIG or DGRO), switch DRIP on, and let growth of the payout do the work. If you do need income, do you need it monthly? If monthly cash flow genuinely matters for budgeting, JEPI — ideally in a tax-advantaged account, sized as an income sleeve rather than your whole portfolio — is the honest tool for that specific job. If quarterly is fine, how much concentration can you stomach? The diversified end is VYM; the quality-screened middle is SCHD; HDV and SPYD pay more and concentrate more, in that order. Finally, which account will hold it? Match the placement to the taxes section above before you place the trade, not after your first 1099-DIV arrives.
Can you own more than one? Of course — a common, sensible pattern is a dividend-growth core (VIG or DGRO) in a Roth IRA, a quality-yield fund (SCHD or VYM) in a taxable or traditional account, and, for retirees, a modest JEPI position for monthly cash flow. Just check overlap before adding a third or fourth fund: SCHD, VYM, and HDV share many of the same blue-chip names, and three funds holding the same fifty companies is one fund with three expense lines and three tax forms.
Questions Dividend Investors Actually Ask
Q: What is the best dividend ETF in 2026?
A: There is no single best dividend ETF for everyone in 2026. SCHD fits investors who want quality-screened current income, VIG and DGRO fit investors who want dividends that grow over time, and JEPI fits investors who specifically need monthly distributions and accept capped upside and higher fees.
Q: How much income does $50,000 in dividend ETFs pay?
A: Using October 2026 yields purely as a hypothetical illustration, $50,000 would pay about $770 a year in VIG at 1.54%, about $1,550 a year in SCHD at 3.10%, and about $3,590 a year in JEPI at a 7.18% distribution rate. These figures are not predictions, because yields change and distributions are never guaranteed.
Q: Is JEPI a dividend ETF?
A: JEPI is not a traditional dividend ETF. It is an actively managed JPMorgan fund that holds large U.S. stocks and sells S&P 500 call options through equity-linked notes, distributing mostly option premium monthly. Its 7.18% October 2026 distribution rate is therefore not comparable to a portfolio dividend yield, and its upside is capped by design.
Q: Are dividend ETF payouts taxed if I reinvest them with DRIP?
A: Yes, in a taxable brokerage account dividends are taxable in the year they are paid even if you reinvest them through DRIP. Qualified dividends are taxed at long-term capital gains rates of 0%, 15%, or 20% depending on income, while ordinary dividends are taxed at regular income rates. Dividends inside a Roth IRA are not taxed as they arrive.
Q: SCHD vs VIG: which is better for beginners?
A: SCHD vs VIG is a choice between income now and growing income. SCHD yielded 3.10% as of October 2026 with 102 quality-screened holdings, while VIG yielded 1.54% with 335 companies that have raised dividends for at least ten years. Beginners who will reinvest for many years often favour growth, while those who want visible income sooner often favour SCHD.
Q: Can dividend ETFs replace my salary in retirement?
A: Dividend ETFs alone rarely replace a salary unless the portfolio is very large, because at a 3.10% yield even $500,000 produces only about $15,500 a year before taxes in a hypothetical illustration. Most retirees combine dividends with Social Security, pensions, interest, and planned withdrawals of capital, and should build that plan with a qualified adviser.
The Bottom Line
The best dividend ETFs 2026 offers are not a mystery list — they are seven well-understood tools, each honest about what it sacrifices. VIG (1.54%, 0.04%) and DGRO (1.95%, 0.08%) sacrifice today’s cheque for a growing one. VYM (2.21%, 0.04%) sacrifices maximisation for breadth. SCHD (3.10%, 0.06%) screens hardest for quality at a spendable yield. HDV (3.34%, 0.08%) and SPYD (4.38%, 0.07%) pay more and concentrate more. JEPI (7.18% distribution rate, 0.35%) pays monthly from option premium and caps your upside to do it. Choose your camp first, your account placement second, and your ticker third — in that order, the decision usually makes itself. Then reinvest patiently, review the fund’s holdings and yield once or twice a year rather than once a week, and remember that in dividend investing, boring and consistent beats exciting and fragile almost every decade.
Disclaimer: This article is for educational purposes only and does not constitute financial, tax, or legal advice. All yields, expense ratios, and holdings are as reported in October 2026 and will change. Investing involves risk, including possible loss of principal, and dividends are not guaranteed.

Muhammad Zakir is the founder of Treasurflow and the author of its personal finance guides. He researches consumer banking, credit, and personal loans, and every guide cites primary sources such as the CFPB, FDIC, FTC, and IRS. His content is educational and is not personalized financial advice.