
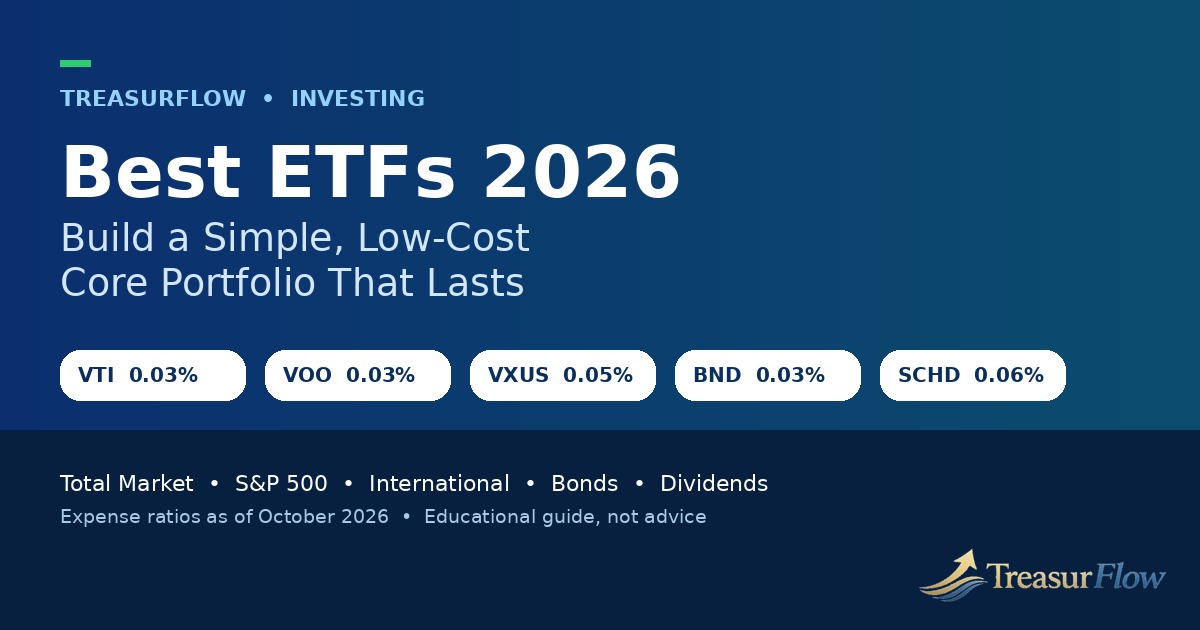
If you are searching for the best ETFs 2026 has to offer, you are probably not looking for a hot tip. You are looking for clarity. There are now thousands of exchange-traded funds listed in the United States, hundreds of them marketed as essential, and a new list of winners published almost every week. Sorting the useful core funds from the noise is the real work — and it is work worth doing carefully, because the ETFs you choose as your core will likely stay in your portfolio for decades, through bull markets, corrections, rate cycles, and headlines that will try to pull you off course.
This guide takes a different approach from most ranking lists. Instead of chasing last year’s returns, it organizes the best ETFs for 2026 by the job each category does in a portfolio: total U.S. stock market exposure for broad growth, S&P 500 exposure for large-company focus, international stocks for geographic diversification, bonds for stability and income, dividend funds for a quality-and-income tilt, and sector or thematic funds — used sparingly and with clear caution — for targeted exposure. For each category you will find established, widely held index ETFs from Vanguard, iShares by BlackRock, Schwab, State Street, and Invesco, with tickers, indexes tracked, and expense ratios verified from provider and market data as of October 2026.
You will also learn how to judge any ETF for yourself in about five minutes — expense ratio, tracking, liquidity and bid-ask spreads, holdings overlap, and tax treatment — so you do not need to rely on anyone else’s list next year. A worked, hypothetical fee example computed in Python shows exactly how much a 0.03 percent fund and a 1.00 percent fund can differ over 30 years on the same contributions, even before markets do anything at all. Sample portfolios, a step-by-step buying guide, and plain-English tax basics round out the guide.
Important disclaimer: This article is educational information only and is not personalized financial, tax, or legal advice. Investing involves risk, including possible loss of principal. Past performance does not guarantee future results. Fund data in this article — expense ratios, assets, and indexes tracked — is stated as of October 2026 and can change; always read the current prospectus and fact sheet on the provider’s website before investing. Consider speaking with a qualified financial or tax professional about your own situation.
Related Guides
- Best Index Funds 2026 — the mutual fund and index fund companions to the ETFs in this guide.
- Best Dividend ETFs 2026 — a deeper look at dividend quality, yield measures, and income-focused funds.
- Best Robo-Advisors 2026 — if you would rather have a service build and rebalance an ETF portfolio for you.
- Best Online Broker 2026 — where to open the account that will hold your ETFs.
Helpful Official Resources
- Investor.gov — Exchange-Traded Funds (ETFs) — the U.S. Securities and Exchange Commission’s investor education site explains how ETFs work and what to check before buying.
- Investor.gov — Mutual Fund and ETF Fees and Expenses Investor Bulletin — how fees reduce returns and where to find the prospectus fee table.
- FINRA — Exchange-Traded Funds and Products — FINRA’s investor guidance on ETF structure, risks, and costs, plus the FINRA Fund Analyzer for comparing funds.
- SEC EDGAR — Fund Prospectus Search — look up any fund’s official filings, prospectus, and shareholder reports directly from the regulator.
Why ETFs Became the Default Building Block in 2026
Twenty years ago, building a diversified portfolio usually meant either picking dozens of individual stocks yourself or paying for an actively managed mutual fund and hoping the manager earned their fee. ETFs changed the default. A single share of a broad index ETF can hold thousands of securities, trade in seconds during market hours, publish its holdings daily, and charge as little as $3 per year for every $10,000 invested. That combination — diversification, transparency, tradability, and very low cost — is why index ETFs now sit at the center of retirement accounts, taxable brokerage accounts, college savings plans, and robo-advisor portfolios alike.
Three structural facts explain most of that success. First, indexing is cheap to run. A fund that tracks the CRSP US Total Market Index or the S&P 500 does not need a large team of analysts visiting companies; it needs disciplined systems to replicate an index accurately, and at scale those systems cost very little per dollar of assets. Second, competition is intense and visible. When Vanguard, iShares, Schwab, and State Street all offer a total market or S&P 500 fund, any provider charging materially more has to explain why, in public, every day, because investors can compare expense ratios in seconds. Third, the ETF creation and redemption mechanism — authorized participants exchanging baskets of securities in kind with the fund — tends to keep trading costs and taxable capital gains lower than in a traditional mutual fund structure. None of that makes every ETF good. Leveraged, inverse, single-stock, and highly concentrated thematic ETFs exist in the same wrapper and carry completely different risks. The wrapper is not the strategy. That is why this guide is organized by category and job first, ticker second.
It also helps to be honest about what an ETF cannot do. A broad stock ETF will fall when the broad market falls. It will not protect you from a bear market, it will not time an exit, and it will not turn a short time horizon into a safe one. Bonds can cushion stock declines in many environments, but 2022 reminded investors that stocks and bonds can fall together when inflation and interest rates rise quickly. Diversification reduces single-company and single-country risk; it does not remove market risk. The best portfolio for 2026 is therefore not the one with the cleverest funds. It is the one whose risks you understand, whose costs you have minimized for the exposure you actually want, and whose allocation you can hold without panic when returns are disappointing for a year or two — because at some point, they will be.
How We Chose the Funds in This Guide
Every fund named as a core example in this guide had to pass the same plain filters. It must be a broadly diversified index ETF in its category, not a leveraged, inverse, or single-stock product. It must have a long operating history, very large assets under management so that closure risk is remote, deep daily trading volume so bid-ask spreads are typically tight, and an expense ratio at or near the lowest available for its exposure as of October 2026. It must track a transparent, rules-based index from a recognized index provider — CRSP, S&P Dow Jones Indices, FTSE Russell, Bloomberg, or Nasdaq — whose methodology you can read for free.
We deliberately name two or three strong options in the largest categories rather than crowning a single winner by one basis point. VTI and ITOT, for example, both charge 0.03 percent as of October 2026 and both cover nearly the entire U.S. stock market; choosing between them is largely a matter of which index and provider you prefer, and whether you already hold one and would trigger taxes by switching. Pretending one is dramatically better would be false precision. Where a category has a clear structural difference — for example, a total market fund holding small companies versus an S&P 500 fund holding only large companies — we explain the difference and who it matters for, rather than hiding it behind a ranking.
A final note on data. Assets under management change daily with markets and investor flows, and expense ratios can change when a provider files an updated prospectus. Figures below are rounded, labeled as of October 2026, and included to show scale — whether a fund manages roughly $70 billion or roughly $560 billion — not to imply that bigger is automatically better past a point of ample scale. Always confirm the live figure on the provider fact sheet. We do not present past return figures as recommendations in this guide. If a yield is ever mentioned in Treasurflow ETF coverage, we label whether it is a 30-day SEC yield or a distribution yield and date it, because the two measures mean different things and neither predicts future income.
Best Total U.S. Stock Market ETFs for 2026
If the phrase best ETFs 2026 means anything useful, it starts here. A total U.S. stock market ETF is the single broadest bet on American business you can buy in one fund: large companies, mid-sized companies, and small companies, across every sector, weighted by market value. You get the giants that dominate headlines and the thousands of smaller companies you have never heard of, in proportion to their size in the market. For many investors, this one category can serve as the entire U.S. stock allocation — no separate large-cap, mid-cap, and small-cap funds required, and no need to rebalance between them when one size segment outperforms another, because the fund already contains all of them.
Vanguard Total Stock Market ETF (VTI)
VTI tracks the CRSP US Total Market Index, which is designed to represent approximately 100 percent of the investable U.S. equity market. As of October 2026, VTI charged an expense ratio of 0.03 percent — $3 per year on a $10,000 investment — and the Vanguard fact sheet reported ETF total net assets of about $560,750 million, with the total fund, including mutual fund share classes, near $2 trillion. That scale, a 2001 inception date, and very high daily trading volume make VTI one of the most established core holdings in the United States. It pays dividends quarterly and holds several thousand stocks, so no single company’s failure can dominate your result, even though the largest technology companies carry meaningful weight simply because they are a large share of the U.S. market by value.
Who should consider VTI? An investor who wants one U.S. stock fund and is comfortable that it includes small and mid-sized companies, which can be more volatile in the short run but complete the market picture. If you already own an S&P 500 fund in a workplace plan, adding VTI in a personal account creates overlap — most of VTI’s weight is in the same large companies — so check your total household allocation rather than collecting tickers account by account.
iShares Core S&P Total U.S. Stock Market ETF (ITOT)
ITOT tracks the S&P Total Market Index and charged 0.03 percent as of October 2026, with assets of roughly $96 billion. Despite the S&P name, this is not the S&P 500; the Total Market Index extends well beyond the 500, covering large, mid, small, and micro-cap U.S. stocks eligible for inclusion. In practical portfolio terms, ITOT and VTI are close substitutes: both are total market, both are 0.03 percent, both are highly liquid, and long-run differences have come from small index construction details rather than from one being fundamentally superior. Investors who prefer BlackRock’s iShares platform, or whose robo-advisor or workplace brokerage window uses ITOT as its core, lose nothing material by using it. What matters is that you pick the total market exposure, keep the fee at this level, and then leave it alone long enough for compounding to matter more than the choice between two excellent funds.
Schwab U.S. Broad Market ETF (SCHB) and the Large-Cap Alternative (SCHX)
Schwab’s broad market lineup offers the same lesson from a third provider: core exposure is now a commodity, and that is good news for investors. Schwab U.S. Large-Cap ETF (SCHX), which tracks the Dow Jones U.S. Large-Cap Total Stock Market Index of roughly the 750 largest U.S. companies, charged 0.03 percent as of October 2026 with assets around $73 billion. SCHX is not a total market fund — it leaves out most small companies — so it behaves more like a large-cap fund with a slightly broader tail than the S&P 500. Mentioning it here is deliberate: many investors searching for a total market fund end up buying a large-cap fund without realizing the difference. Read the index name, not just the fund marketing name. If the index says large-cap, you own large companies. If it says total market, you own the full market. Either can have a place, but they are not the same decision.
Category takeaway: For a U.S. stock core, prioritize a 0.03 percent total market fund — VTI or ITOT are the textbook examples as of October 2026 — and treat any fund charging several times more for the same broad exposure with skepticism. You should be able to state, in one sentence, what extra exposure the extra fee buys.
Best S&P 500 ETFs for 2026
The S&P 500 remains the most quoted measure of U.S. large-company performance in the world, and for good reason: 500 leading companies, selected by a committee under published rules maintained by S&P Dow Jones Indices, representing a large share of total U.S. market value, with a methodology and history that researchers, journalists, and retirement plans all share. An S&P 500 ETF is therefore the most familiar core fund in America. It is not the whole market — it excludes most mid and small companies and all non-U.S. companies — but what it includes, it includes at extremely low cost and with unmatched public scrutiny.
Vanguard S&P 500 ETF (VOO)
VOO tracks the S&P 500 Index and charged 0.03 percent as of October 2026. It is routinely described in provider and press coverage as among the largest ETFs in the world, with net assets around the trillion-dollar scale for the fund complex. For investors, the operational facts matter more than the superlative: extremely tight typical bid-ask spreads, enormous trading volume, quarterly dividends, and a track record of closely following its index. If your workplace plan, your robo-advisor, or your own preference is framed in S&P 500 terms — as much of American financial media is — VOO delivers that exposure at the lowest tier of cost.
SPDR Portfolio S&P 500 ETF (SPYM) and iShares Core S&P 500 ETF (IVV)
State Street’s SPDR Portfolio S&P 500 ETF (SPYM) was listed at a 0.02 percent expense ratio in October 2026 market coverage, with assets above $180 billion — a reminder that the cheapest headline fee in this category is now two basis points, one basis point below VOO and IVV’s long-standing 0.03 percent level. iShares Core S&P 500 ETF (IVV) also tracks the S&P 500 at 0.03 percent and is a core holding in many model portfolios. Does one basis point matter? On $100,000, the difference between 0.02 percent and 0.03 percent is $10 per year before compounding — real money over a lifetime, but small compared with the cost of selling a fund you already own and paying tax on a gain just to save it, or compared with holding cash for months while deciding. If you are starting fresh, the lowest fee for identical index exposure is a rational tiebreaker. If you already hold a 0.03 percent S&P 500 fund in a taxable account with a large gain, switching solely for one basis point is rarely the first move a careful investor makes. New contributions can go to the cheaper fund if you wish, without a taxable sale.
A common question is whether you need both an S&P 500 fund and a total market fund. In most portfolios, no. The S&P 500 makes up the great majority of a total market fund’s value, so holding both is mostly holding the same large companies twice, with a modest small-company addition from the total market fund. Choose the framing you prefer — total market for completeness, S&P 500 for familiarity and comparability — and build the rest of the portfolio around that choice. Simplicity here is a feature. Every redundant fund is another holding to monitor, rebalance, and explain to yourself at tax time.
Best International Stock ETFs for 2026
U.S. stocks have delivered exceptional returns over the past decade and a half, which is precisely why international diversification is easy to skip and important not to. At various points in market history — the 2000s are a recent example — non-U.S. stocks outperformed U.S. stocks for years at a time, and valuations, dividend yields, sector mixes, and currency exposure outside the United States are genuinely different. International stock ETFs hold companies in developed markets such as Japan, the United Kingdom, Canada, France, and Switzerland, and in emerging markets such as India, Taiwan, and Brazil, depending on the index. That breadth comes with additional risks: currency swings add volatility for a U.S.-based investor, political and regulatory systems differ, and emerging markets can fall sharply. Diversification across countries is a long-horizon risk management decision, not a prediction that international stocks will win next year.
Vanguard Total International Stock ETF (VXUS)
VXUS tracks the FTSE Global All Cap ex US Index, covering developed and emerging markets outside the United States — roughly 99 percent of the global market capitalization outside the U.S., in the index provider’s description. As of October 2026, VXUS charged 0.05 percent and managed roughly $160 billion in assets, with a share price in the low $80s in mid-October 2026 market data. A 0.05 percent fee for exposure to thousands of non-U.S. companies across dozens of countries is a striking example of how far ETF costs have fallen; a generation ago, international diversification at any price required either expensive funds or direct foreign brokerage access. VXUS is the natural international companion to VTI in a Vanguard-based core, and it pairs equally well with an S&P 500 fund if you accept that pairing leaves a small-company gap on the U.S. side.
Vanguard Total World Stock ETF (VT) — The One-Fund Stock Option
VT tracks the FTSE Global All Cap Index — in effect, VTI plus VXUS in a single fund, weighted by global market capitalization, with the United States representing a majority of world market value. For an investor who wants global stock diversification without ever rebalancing between a U.S. and an international fund, VT is the cleanest educational example in this guide. The trade-off is control: you cannot set your own U.S.-to-international ratio, and you still need a separate bond decision for most portfolios. Investors who want a specific international weight — for example, 20 percent or 40 percent of their stock allocation — will prefer the separate VTI plus VXUS structure. Investors who value never having to make that decision may prefer VT. Both are defensible; the indefensible version is owning five overlapping global funds because each appeared on a different list.
iShares Core MSCI Total International Stock ETF (IXUS)
IXUS tracks an MSCI total international index and has long been iShares’ core answer to VXUS, at a higher headline fee than VXUS in recent years — check the live iShares fact sheet, because this is exactly the comparison the FINRA Fund Analyzer and provider fee tables exist for. We mention IXUS to teach the habit, not to crown it: when two funds offer near-identical geographic exposure, line up expense ratio, assets, spreads, and index methodology side by side, and let the total cost of owning — not brand habit — decide. If your account already holds IXUS at a gain, the tax cost of switching may outweigh a small fee difference, the same logic as in the S&P 500 category.
Category takeaway: Decide your international share of stocks first — many educational model portfolios illustrate 20 percent to 40 percent of the equity allocation — then implement it with one broad ex-U.S. fund such as VXUS at 0.05 percent as of October 2026, or sidestep the decision with a total world fund such as VT for the stock portion.
Best Bond ETFs for 2026
Bonds are the least exciting part of most portfolios and, in a stock market decline, often the most appreciated. A broad U.S. bond ETF holds thousands of investment-grade bonds — U.S. Treasury securities, agency mortgage-backed securities, and corporate bonds — and pays interest distributions, typically monthly for bond funds. Its job is not to beat stocks. Its job is to provide income, to dampen overall portfolio swings, and to give you something relatively stable to rebalance from when stocks fall and something to rebalance into when stocks soar. Bond prices move inversely with interest rates, so a bond fund can lose value when rates rise, as investors learned painfully in 2022. That risk is measured in part by duration: longer duration means larger price moves for a given rate change. A broad aggregate bond fund carries intermediate duration — meaningful movement, but far less than a long-term Treasury fund.
Vanguard Total Bond Market ETF (BND)
BND tracks the Bloomberg U.S. Aggregate Float Adjusted Index, the standard benchmark for the U.S. investment-grade bond market. As of October 2026, BND charged 0.03 percent and managed roughly $163 billion in assets. At three basis points, the cost of professional bond diversification — thousands of bonds, daily liquidity, monthly distributions — is lower than what most individual investors could achieve buying bonds one at a time, where bid-ask spreads on small lots can be punishing. BND is the default bond core in countless three-fund portfolios for exactly this reason. It holds no high-yield junk bonds and no foreign bonds in size; if you want those exposures, they are separate, conscious decisions, not something to assume BND covers.
iShares Core U.S. Aggregate Bond ETF (AGG)
AGG tracks the Bloomberg U.S. Aggregate Bond Index and charged 0.03 percent as of October 2026, with assets of roughly $138 billion. In portfolio function, AGG and BND are close substitutes — both are aggregate index, both are 0.03 percent, both are extremely liquid — with minor index float-adjustment and construction differences that have not historically driven large outcome gaps. As with VTI and ITOT, the lesson is liberating: in the core categories, the major providers have competed costs down to a level where your savings rate, your allocation, and your behavior will matter far more than which of the two excellent funds sits in your account. Pick one, automate contributions, and spend your attention on the decisions that actually move the needle.
Investors with shorter horizons sometimes add a short-term bond or Treasury ETF alongside an aggregate fund to reduce duration risk, and investors in higher tax brackets sometimes evaluate municipal bond ETFs for tax-exempt income in taxable accounts. Both are legitimate second-step considerations, but neither replaces the core question: what share of your portfolio should be in bonds at all, given your time horizon and your honest tolerance for seeing the total balance fall? A portfolio that is 100 percent stocks can fall 40 percent or more in a severe bear market. A portfolio with a meaningful bond allocation will usually fall less, and that difference is what allows many investors to stay invested — which, historically, has mattered more than squeezing out the last fraction of expected return.
Best Dividend ETFs for 2026
Dividend ETFs appeal to two different instincts, and it helps to separate them. The first is practical: some investors, especially in retirement, like receiving regular cash distributions. The second is strategic: a rules-based dividend fund is often really a quality and value fund in disguise, screening for companies with durable cash flows, balance sheet strength, and a record of returning cash to shareholders. Both instincts are understandable. Neither makes dividends free money. When a company pays a dividend, its share price adjusts downward by roughly the dividend amount on the ex-dividend date, all else equal; total return — price change plus distributions reinvested — is the full picture. In a taxable account, dividends are also taxed in the year received, whether you spend them or reinvest them, which is why yield alone is a dangerous ranking metric.
Schwab U.S. Dividend Equity ETF (SCHD)
SCHD tracks the Dow Jones U.S. Dividend 100 Index and charged 0.06 percent as of October 2026, with assets of roughly $115 billion in October 2026 market coverage. The index requires a history of consistently paying dividends — the methodology screens on dividend payment history — and then ranks eligible companies on fundamentals including cash flow to total debt, return on equity, dividend yield, and five-year dividend growth. The result is a portfolio of about 100 U.S. dividend payers, weighted and capped under the index rules, with no real estate investment trusts under the current methodology. That construction explains SCHD’s popularity better than any yield headline: it is a quality-screened dividend strategy at an index-fund price. Its distributions are paid quarterly. If you cite its yield in your own research, label the measure — providers and data sites variously show a 30-day SEC yield and a trailing distribution yield, which will not match, and neither guarantees future distributions.
Vanguard High Dividend Yield ETF (VYM) and Dividend Appreciation ETF (VIG)
Vanguard offers the two complementary philosophies in one family. VYM, at 0.06 percent in recent provider data, targets higher-yielding U.S. dividend payers — more current income, more exposure to slower-growing, cash-rich sectors. VIG, at 0.05 percent, targets companies with a record of increasing dividends over time — less current yield, more emphasis on dividend growth and quality. Choosing between a high-yield approach and a dividend-growth approach is choosing what you want the tilt to do: emphasize income today, or emphasize companies whose payouts have grown. Neither replaces a total market core for most investors, because both exclude non-dividend payers entirely — and some of the largest growth companies in the U.S. market have historically paid little or no dividend. A portfolio built only from dividend funds is a concentrated bet on mature, cash-distributing companies, whether the investor intended that bet or not.
Category takeaway: Use a dividend ETF as a tilt around a broad core, sized so that if dividend payers lag the total market for several years — as high-yield strategies did during long stretches of growth-stock leadership — you will still be satisfied with your overall portfolio. If income in a taxable account creates a tax bill you did not plan for, that is a placement problem to solve before it is a fund problem.
Sector and Thematic ETFs — Useful Tools, Handled With Caution
Every category so far has been about owning more of the market, more cheaply. Sector and thematic ETFs are about owning less of the market, more deliberately — and that inversion deserves extra skepticism. A sector ETF holds one slice of the economy: technology, health care, financials, energy, utilities, and so on, under the standard sector classification system. A thematic ETF holds a story: artificial intelligence, cybersecurity, clean energy, robotics, semiconductors. Stories are compelling, and some themes will indeed shape the next decade. The investment problem is timing and price. By the time a theme is popular enough to support a shelf of ETFs, much of the optimism is often already in the prices of its leading companies, many of which you already own through your total market fund.
Consider the mechanics. Vanguard Information Technology ETF (VGT), at 0.09 percent in recent provider data, holds several hundred U.S. information technology companies and is a legitimate, low-cost sector fund as sector funds go. VanEck Semiconductor ETF (SMH) and iShares Semiconductor ETF (SOXX) concentrate further, into the chip industry that powered much of the market’s recent advance — and that has historically swung violently with the semiconductor cycle. Healthcare funds such as Health Care Select Sector SPDR (XLV), utility funds, and clean energy funds such as iShares Global Clean Energy ETF (ICLN) each carry their own regulatory, commodity, and interest-rate sensitivities. None of these facts makes a sector fund wrong. They make it a concentrated position that should be sized like one.
Our educational framework for this category is strict. First, fund the core completely before any sector position exists. Second, cap the total of all sector and thematic holdings at a small share of the portfolio — many educational examples use 5 percent to 10 percent as an illustration — so that a 40 percent drawdown in a theme is painful but not portfolio-defining. Third, write down, before buying, what would make you sell or rebalance: a target weight, a rebalancing band, or a date to reassess. Thematic funds also tend to charge more — expense ratios of 0.35 percent to 0.75 percent are common in this category, versus 0.03 percent for the core — and to trade with wider spreads and higher turnover inside the fund. That cost and concentration combination is the opposite of the core proposition. If a theme matters to you, the cheapest way to own more of it is often a broad sector index fund from a major provider, held small, rather than the newest narrow product launched at the peak of the story’s popularity.
A special warning belongs here for leveraged and inverse ETFs, which reset daily and are designed as short-term trading tools, not long-term holdings. FINRA and the SEC have warned repeatedly that holding daily-reset products for longer than a day can produce results that diverge sharply — and negatively — from the index move over the full period, especially in volatile markets. They are not part of a core portfolio guide, and their presence in an ETF list should prompt you to ask what audience that list was actually built for.
How to Judge Any ETF: A Five-Minute Checklist
Lists age. Judgment compounds. Once you can evaluate an ETF yourself, every future list — including future editions of this one — becomes a starting point you can verify rather than an instruction you must trust. Work through these five checks in order; a fund that fails an early check rarely redeems itself later in the list.
1. Expense Ratio — The Fee You Pay Every Year
The expense ratio is the percentage of the fund’s assets used each year to pay operating expenses, as the SEC’s Investor.gov bulletin explains: management fees, administrative costs, and, for some mutual funds, distribution or 12b-1 fees, which typically do not apply to ETFs. It is not billed to you directly; it is deducted from the fund’s returns, invisibly, every day. That invisibility is why it is underestimated. A 0.03 percent fund on $10,000 costs $3 in the first year. A 1.00 percent fund costs $100. The $97 gap feels trivial — until you compound it, as the worked example below does, and discover that the gap grows with the portfolio itself, because the fee is a percentage of a growing balance, taken in good years and bad, whether the fund performed well or not. The prospectus fee table is the authoritative source; provider fact sheets and FINRA’s Fund Analyzer present the same figure in comparison form. Compare expense ratios only within the same exposure: a 0.05 percent international fund is cheap for international exposure, and a 0.50 percent total market fund is expensive for total market exposure, even though 0.50 is a larger number than the international fund deserves praise for beating.
2. Index and Tracking — What the Fund Is Supposed to Do, and How Well It Does It
Find the exact index name on the fact sheet. Total market, S&P 500, aggregate bond, and dividend 100 are different promises. Then check tracking: index funds publish returns for the fund and for the benchmark over the same periods, and the small gap between them — tracking difference — reflects fees, trading costs, and how completely the fund replicates the index, sometimes by holding every security and sometimes by representative sampling of a large index. A good core index ETF tracks tightly and consistently. Also read the top ten holdings and sector weights, which every major provider publishes. If you own three funds whose top holdings are the same seven companies in similar weights, you own one bet in three wrappers, and your diversification is thinner than your ticker count suggests.
3. Liquidity and Bid-Ask Spreads — The Cost of Getting In and Out
An ETF’s trading cost to you is not just the expense ratio. When you buy, you pay the ask price; when you sell, you receive the bid; the difference — the spread — is a one-time cost on each trade that never appears in the expense ratio. For VOO, VTI, BND, AGG, and other giant core funds, spreads are typically a penny or a few basis points in normal markets. For small, new, or niche funds, spreads can be many times wider, and the premium or discount to net asset value can move as well. Practical defenses are simple and come straight from investor education guidance: favor funds with large assets and high average daily volume for core positions, use limit orders rather than market orders — especially near the market open and close, when spreads widen — and avoid trading in the first and last minutes of the session. Liquidity of the underlying holdings matters too; an ETF holding illiquid bonds or tiny stocks can trade at a visible discount in stressed markets even if its own trading volume looks adequate on a calm day.
4. Size, Age, and Holdings Overlap
Large assets and a long history do not guarantee good future returns, but they do reduce operational risks: the risk that a fund closes and forces a taxable sale, the risk that spreads stay wide because market makers see little flow, and the risk that you are the test case for an unproven index. As a practical screen for core funds, investors commonly look for at least several hundred million dollars in assets and several years of history, a bar every core fund in this guide clears by orders of magnitude. Then check overlap, the most neglected step in portfolio building. Free holdings pages let you compare your funds’ top positions in minutes. Overlap between a total market fund and an S&P 500 fund is expected and high; overlap between your new thematic fund and your core may reveal that you are doubling a bet you thought you were diversifying.
5. Structure and Taxes — What Kind of Product Is It, Really?
Most core ETFs in this guide are open-end funds registered under the Investment Company Act, the same legal framework as mutual funds, with an ETF share structure. Other exchange-traded products are not: exchange-traded notes are unsecured debt of an issuer and carry credit risk, and some commodity and leveraged products use futures or swaps with different tax forms, including Schedule K-1s in certain structures. The prospectus and the Investor.gov product descriptions will tell you which you are holding — but only if you read them before the tax form arrives. For plain equity and bond index ETFs, tax treatment is straightforward and covered in the tax section below. For anything that promises more than market exposure, slow down at this check. Complexity is a cost even when it is not itemized.
ETF vs. Mutual Fund vs. Index Fund: Clearing Up the Three-Way Confusion
No terminology in personal finance causes more unnecessary confusion than these three labels, because they describe different dimensions of the same products. Index fund describes a strategy: a fund that tracks an index rather than trying to beat it through active selection. Mutual fund and ETF describe legal and trading structures: how you buy, sell, and hold the strategy. An index fund can be a mutual fund or an ETF. An actively managed fund can also be either. When someone asks whether ETFs are better than index funds, they are comparing a structure with a strategy — the question only makes sense once the dimensions are separated.
In a mutual fund, you transact directly with the fund company, once per day, at the net asset value calculated after the market close. You can usually invest an exact dollar amount, automate a monthly purchase down to the dollar, and reinvest distributions automatically with no spread and no premium or discount. Many workplace retirement plans offer index mutual funds and nothing else, and at institutional pricing those funds can be as cheap as any ETF. In an ETF, you transact on an exchange with other investors during the day, at a market price that tracks net asset value closely but is not identical to it, paying or receiving the bid-ask spread. Minimums are typically the price of one share — and many brokers now offer fractional shares — and you gain intraday flexibility that, for a long-term investor, is mostly valuable for rebalancing and tax management rather than for trading.
Costs now overlap so heavily that structure alone rarely decides. A total market exposure at 0.03 percent as an ETF and a comparable index mutual fund at a similar level are economically near-identical before taxes and trading frictions. Where ETFs have historically held an edge is tax efficiency in taxable accounts, explained below, and portability: an ETF moves between brokers as a security, while a mutual fund — especially a provider’s proprietary fund — may be less portable or may carry a transaction fee at another firm. Where mutual funds hold an edge is automation and behavior: exact-dollar automatic investing, no spread, no intraday price to watch, and no temptation that comes with a ticker moving on your phone all day. Honest guidance in 2026 is therefore unglamorous. In a 401(k), use the low-cost index mutual funds you are offered. In an IRA or a taxable account where you value portability and tax efficiency, low-cost index ETFs are an excellent default. In either structure, the word index and the expense ratio matter more than the wrapper.
The Math That Matters Most: A Hypothetical Fee-Drag Worked Example
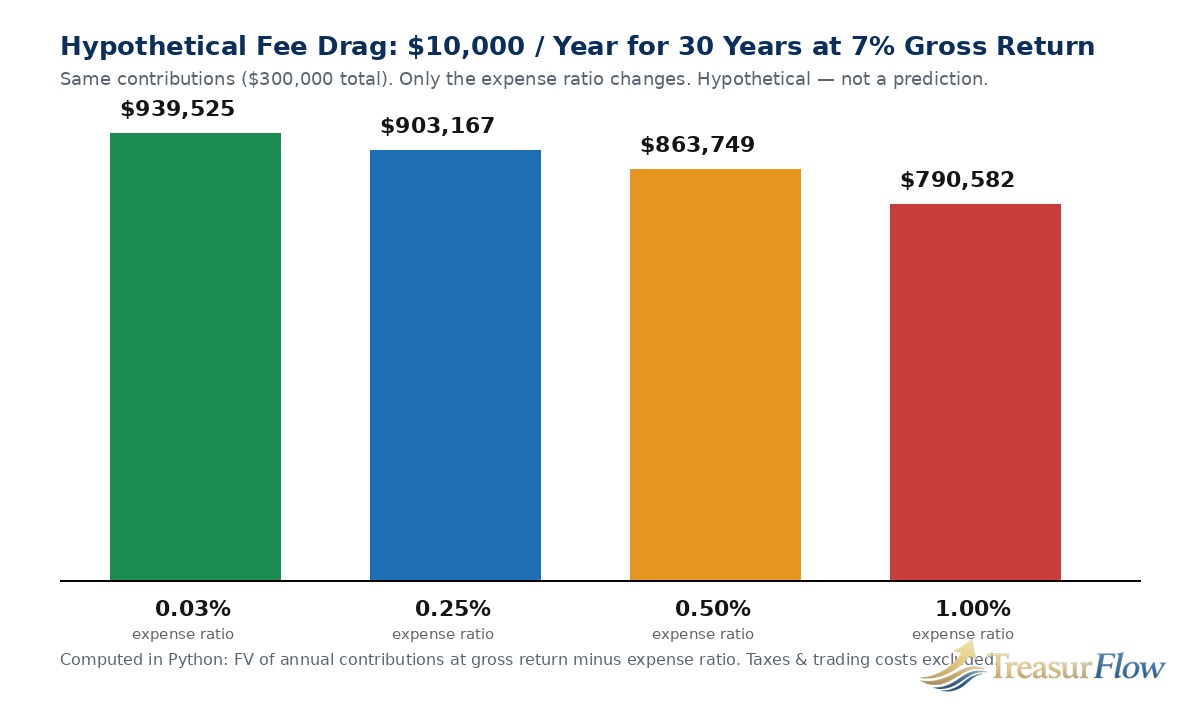
Fees feel abstract as percentages. They are concrete as dollars, and the clearest way to see them is to hold everything else constant — same contributions, same gross return, same years — and change only the expense ratio. The example below was computed in Python using the standard future value of a series of annual contributions. It is hypothetical, simplified, and labeled as such: it is not a prediction, not a fund’s performance, and not a guarantee of any return.
Assumptions: You contribute $10,000 at the end of each year for 30 years — $300,000 contributed in total. The portfolio earns a hypothetical gross return of 7.00 percent per year before fund expenses, every year, with no taxes, no trading costs, and no variation. The expense ratio is subtracted from that gross return each year. Real markets do not return a smooth 7 percent, real portfolios incur taxes and other costs, and no fund in this guide promises 7 percent or any other figure. The point of smoothing everything else away is to isolate the single variable under study: the fee.
| Annual expense ratio | Net return in this model | Value after 30 years | Cost versus the 0.03% fund |
|---|---|---|---|
| 0.03% (core index ETF level) | 6.97% | $939,525 | — |
| 0.25% (typical active / specialty level) | 6.75% | $903,167 | $36,358 less |
| 0.50% | 6.50% | $863,749 | $75,776 less |
| 1.00% | 6.00% | $790,582 | $148,943 less |
| 0.00% (no fee, for reference) | 7.00% | $944,608 | $5,083 more than 0.03% |
Read the table slowly, because it overturns the intuition that small percentages are small money. The investor in the 1.00 percent fund contributed the same $300,000, took the same market risk in this model, and ended with about $148,943 less than the investor in the 0.03 percent fund — roughly half of everything they contributed, surrendered not to a market crash but to a fee that sounded like one percent. Even the step from 0.03 percent to 0.25 percent — a gap many investors dismiss as rounding — cost $36,358 in this model, more than three full years of contributions. Notice also the top row comparison: moving from no fee at all to a 0.03 percent core ETF costs only about $5,083 over 30 years in this model. Professional diversification, daily liquidity, and thousands of holdings for a lifetime cost of roughly five thousand dollars on this contribution path is the bargain at the heart of index ETFs — which is exactly why paying thirty times more for the same market exposure needs a thirty-times-better justification.
Two honest qualifications complete the example. First, a higher fee is not automatically waste: international diversification, a dividend strategy, or an actively managed fund in a category where indexing is harder may legitimately cost more, and the question is always whether the different exposure — not a promised outperformance — is worth it to you. Second, fees are the most predictable part of the equation, not the only part. Taxes, spreads, your savings rate, and your willingness to hold through a downturn will each move your outcome by more than the difference between VTI and ITOT ever will. Control the fee because it is controllable. Do not obsess over it at the expense of the larger decisions.
Sample Simple Portfolios Using These Categories
Allocations teach better than adjectives. The three educational examples below use only the categories covered in this guide, expressed in tickers so you can see how few funds a complete portfolio actually needs. They are illustrations of structure, not recommendations for you: the right allocation depends on your time horizon, your need and tolerance for risk, your other accounts, and your tax situation. Percentages are of the total portfolio.
The Three-Fund Portfolio
60 percent total U.S. stock market (VTI or ITOT), 20 percent total international stock (VXUS), 20 percent total U.S. bond market (BND or AGG). This is the reference portfolio against which most simple portfolios are measured, popularized in investor education communities precisely because it refuses to be clever. Stocks dominate for long horizons, international exposure is meaningful but not equal-weighted, and bonds are present in a share large enough to matter in a downturn. Rebalance once a year back to the target percentages, or direct new contributions toward whichever category has drifted furthest below target, which avoids selling in taxable accounts.
The Two-Fund Portfolio
80 percent total world stock (VT), 20 percent total U.S. bond market (BND or AGG). For the investor who knows that choosing and maintaining a U.S.-to-international split will become a reason to tinker, this structure removes the decision entirely: the world fund holds markets at their global weights and adjusts as those weights change. You give up control of the international percentage and of U.S. bond versus global bond nuance. In exchange, you get a portfolio you can explain in one sentence and maintain in one annual rebalance — a trade many experienced investors have come to respect.
The Core-Plus-Income Illustration
50 percent total U.S. stock market (VTI), 15 percent total international stock (VXUS), 10 percent dividend equity (SCHD), 25 percent total U.S. bond market (BND). This example shows how a dividend tilt is added responsibly: the core stays intact and dominant, the tilt is a defined tenth of the portfolio, and bonds rise slightly to reflect the more income-oriented investor who typically requests it. If SCHD lags the total market for years, the portfolio still behaves primarily like a diversified core portfolio. That is the test every satellite position should pass — the portfolio should still make sense if the satellite is its worst performer.
What none of these examples contains is equally instructive: no sector fund by default, no thematic fund, no leveraged product, no single stock. Those positions, if you choose them at all, belong outside and on top of a funded core, at sizes governed by the caution framework in the sector section above. A portfolio is not a collection of your enthusiasms. It is a structure for funding future spending, and structure comes first.
How to Buy ETFs: A Step-by-Step Walkthrough
Buying your first ETF takes about as long as ordering a book online, once the account exists. The steps below assume a U.S. investor using a taxable brokerage account or an IRA at a major broker — see our guide to the best online brokers for the account decision itself — and they apply to any fund in this guide.
First, open and fund the right account. Decide whether this money belongs in a tax-advantaged account — a workplace plan, a traditional or Roth IRA, or a health savings account if eligible — before defaulting to a taxable brokerage account, because the account’s tax treatment will usually matter more than the last basis point of fund cost. Fund the account by bank transfer and wait for the cash to settle and show as available to trade.
Second, look up the fund on the provider’s site before you look it up on the broker’s. Confirm the ticker, the full fund name, the index, and the expense ratio on the Vanguard, iShares, Schwab, or State Street fact sheet. Tickers are short and typos are expensive; funds with similar names can have entirely different holdings. While you are there, note the fund’s distribution schedule so a dividend payment shortly after purchase does not surprise you at tax time — buying just before a distribution in a taxable account can mean receiving and being taxed on a payout that largely reflects value accrued before you arrived, sometimes called buying a dividend.
Third, place the order with a limit price. Search the ticker in your brokerage app, choose Buy, enter the number of shares or the dollar amount if fractional shares are offered, and select a limit order priced at or very near the current ask. A limit order guarantees you will not pay more than your price if the market jumps in the seconds after you tap; a market order guarantees execution but not price. Trade during regular market hours, ideally mid-morning or mid-afternoon rather than in the volatile first minutes after the open. For core funds with penny-wide spreads, this care is worth pennies — but building the habit costs nothing and protects you on every less-liquid fund you will ever trade.
Fourth, automate what can be automated. Set a recurring contribution and, where your broker supports it, an automatic purchase program, so the portfolio grows by default rather than by motivation. Turn on dividend reinvestment if the account is tax-advantaged or if you want distributions compounded without a manual step; in a taxable account, some investors direct distributions to cash to help rebalance and to keep lot records cleaner, which is a preference, not a rule. Finally, write down your target allocation and your rebalancing rule — once a year is enough for most core portfolios — and then give the plan the one ingredient no fund can supply: time without interference.
Tax Basics Every ETF Investor Should Understand
Taxes will not appear in any fund’s marketing headline, but for a taxable account they can cost more than the expense ratio. This section is general education about how U.S. federal taxation of ETFs commonly works, not tax advice for your return; state rules, your bracket, and your other income all matter, and a tax professional can apply them to you.
Start with the two moments tax can arise. While you hold the fund, distributions are taxable in the year paid: dividends from stock ETFs and interest from bond ETFs are reported to you on Form 1099, with stock dividends often largely qualified — taxed at the lower long-term capital gains rates — if holding period and other requirements are met, while bond interest is generally taxed as ordinary income, except for tax-exempt municipal bond funds. When you sell, you realize a capital gain or loss equal to the difference between your proceeds and your cost basis; shares held more than one year generally qualify for long-term rates, shares held one year or less are taxed at short-term, ordinary-income rates. Keep the broker’s cost basis records, and be aware of the wash sale rule if you sell at a loss and buy a substantially identical fund within 30 days before or after the sale — a rule that also shapes how tax-loss harvesting between similar but not identical funds, such as swapping a total market fund for an S&P 500 fund, is commonly discussed in investor education material.
Why are index ETFs often described as tax-efficient? The answer is the in-kind mechanism introduced earlier. When a traditional mutual fund faces redemptions or rebalances, it may sell securities for cash and realize gains that must be distributed to all remaining shareholders, including people who just bought in. An ETF meets most redemptions by delivering securities in kind to authorized participants, which lets the fund remove low-basis holdings without a cash sale, and its index turnover is low to begin with. The result, historically, is that broad equity index ETFs have distributed capital gains rarely compared with many actively managed mutual funds. Rarely is not never — bond ETFs, international ETFs, and funds in stressed markets can and do distribute gains — and dividends remain taxable every year regardless. The practical placement framework that follows from this is widely taught: hold tax-efficient broad equity ETFs in taxable accounts where reasonable, hold ordinary-income-heavy assets such as taxable bond funds preferentially in tax-advantaged accounts when you have the space, and hold the whole picture — all accounts combined — to your target allocation rather than optimizing each account in isolation.
Inside an IRA or a workplace retirement plan, none of the annual distribution taxation applies: you are taxed under the account’s rules, on withdrawal for traditional accounts or generally not at all for qualified Roth withdrawals, and rebalancing inside the account is not a taxable event. That shelter is valuable and limited by annual contribution rules, which is another reason the account decision in step one of the buying guide deserves more of your attention than any single fund choice in this article.
Best ETFs 2026 — Your Top Portfolio, Cost, and Tax Questions Answered
What is the best ETF to buy in 2026 if I can only pick one?
If you can only pick one fund, many long-term investors start with a total U.S. stock market ETF such as VTI or ITOT, or a total world stock ETF such as VT, because a single fund gives you thousands of companies in one trade. The right single fund still depends on your goals, time horizon, and whether you also need bonds, so treat this as an educational starting point, not a personal recommendation.
What expense ratio should I look for in the best ETFs for 2026?
For core index ETFs in 2026, look for expense ratios at or below 0.10 percent, and ideally 0.03 percent to 0.06 percent for U.S. total market, S and P 500, and U.S. bond funds as of October 2026. A higher fee can be reasonable for international, dividend, or specialized exposure, but the fund must deliver something meaningfully different to justify it. Always check the current prospectus fee table before you buy.
Are ETFs better than mutual funds for beginners?
Neither is automatically better. ETFs trade throughout the day, often have low minimums of one share, and tend to be tax-efficient in taxable accounts because of in-kind creation and redemption. Mutual funds trade once a day at net asset value, can be easier to automate with exact dollar amounts, and are common in workplace retirement plans. Many index funds are available in both forms, so choose based on cost, automation, and the account you have.
How are ETFs taxed in a regular brokerage account?
In a taxable brokerage account in the United States, you generally pay tax on dividends and interest distributions in the year you receive them, and on capital gains when you sell shares for more than you paid. Broad index ETFs have historically distributed fewer capital gains than many actively managed mutual funds, but they are not tax-free. Holding tax-efficient equity ETFs in taxable accounts and interest-heavy bond funds in tax-advantaged accounts is a common educational framework, not personal tax advice.
How many ETFs do I actually need in a portfolio?
Most simple core portfolios use two to four ETFs: one for U.S. stocks, one for international stocks, and one for U.S. bonds, with an optional fourth for a specific goal. Adding more funds does not automatically add diversification if the holdings overlap heavily. Start with broad categories, check overlap in the top holdings, and only add a dividend or sector fund when you can explain in one sentence what job it does that your core funds do not.
Do dividend ETFs like SCHD make sense for income in 2026?
A dividend ETF such as SCHD, which tracks the Dow Jones U.S. Dividend 100 Index and charged 0.06 percent as of October 2026, can make sense if you want a rules-based focus on companies with a history of paying dividends and screens for quality and dividend sustainability. Dividends are not guaranteed, the fund is concentrated in U.S. dividend payers, and dividend income is taxable in a brokerage account. Evaluate total return, holdings, and taxes, not yield alone.
Conclusion: The Best ETFs for 2026 Are the Ones You Will Actually Hold
Strip away the tickers and the best ETFs 2026 guide reduces to a short creed. Own the whole market in each category you need, at the lowest fee available for that exposure — 0.03 percent for U.S. stocks and U.S. bonds, 0.05 percent for international stocks, 0.06 percent for a quality dividend tilt, all as of October 2026. Judge every fund by its index, its tracking, its spreads, and its tax behavior, not by its story or its last year. Treat sector and thematic funds as seasoning, capped and pre-committed, never as the meal. Let the fee example stay with you: on identical contributions and identical hypothetical gross returns, the difference between a 0.03 percent core and a 1.00 percent fund was about $148,943 over 30 years — money that required no extra risk to keep, only a cheaper wrapper for the same market.
None of this will feel exciting in any given month, and that is the point. The investors who benefit most from ETFs are rarely the ones who find the most funds; they are the ones who find a sound structure early, automate it, and then direct their attention to their savings rate, their careers, and their lives, checking the portfolio on a schedule instead of on a feeling. Start with the categories. Confirm the facts on the provider fact sheet. Place the trade carefully. Then let compounding — the only free lunch’s quieter, more reliable sibling — do the heavy lifting.
Data note: Expense ratios, indexes tracked, and asset figures for VTI, VOO, VXUS, VT, BND, ITOT, AGG, SCHD, SCHX, SPYM, and other funds mentioned were verified against provider fact sheets and market data sources available in October 2026 and are labeled as of October 2026 throughout. Figures change over time; verify current data before investing. This article is for education only and is not financial advice.

Muhammad Zakir is the founder of Treasurflow and the author of its personal finance guides. He researches consumer banking, credit, and personal loans, and every guide cites primary sources such as the CFPB, FDIC, FTC, and IRS. His content is educational and is not personalized financial advice.